Events in Iraq Waking Commodities Up?
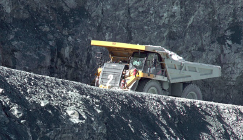
Chart 1: US moves aircraft carrier to Gulf. Are military airstrikes coming?

Source: The Guardian
Markets have been quite complacent as of late, seen by incredibly low volatility across all asset classes (chart here and here). However, volatility could now start picking up with potential crisis flaring up in the Middle East. The Guardian yesterday reported recent US developments towards the Iraq Crisis.
The US is sending an aircraft carrier and two guided missile ships into the Persian Gulf, bolstering sea and airpower before a possible US strike on the jihadist army in Iraq in the coming days.
Defense secretary Chuck Hagel ordered the USS George HW Bush into the Gulf on Saturday, a day after President Barack Obama indicated he would soon decide on air strikes against the Islamic State of Iraq and the Levant (Isis), whose seizure of Sunni Iraqi cities has violently upended the region.
The 103,000-tonne warship and its air wing, which had been patrolling the North Arabian Sea and earlier this year were used in the Mediterranean following Russia’s invasion of Ukraine, gives Obama airstrike options in addition to air force assets on land in bases used by the US, like Qatar’s al-Udeid.
Rear Admiral John Kirby, the Pentagon press secretary, said the Bush would be accompanied by the guided-missile cruiser USS Philippine Sea and the guided-missile destroyer USS Truxton. The ships are expected to arrive in the Gulf this evening.
Chart 2: Commodities tend to benefit during military conflicts & tensions

Source: Short Side of Long
If the military conflict does arise in coming days or weeks, it could definitely affect financial markets and rise volatility. It seems a lot of fund managers are discussing or even bracing for a potential correction in the stock market. S&P 500 recently became extremely overbought from the short term perspective. However, stocks aren’t the only game in town. Personally, I think it is just as important to look at what the commodity markets are doing. After all, its commodities have done extremely well during military conflicts, especially if Iraq was to flare up into a full blown crisis around the region (at this point very unlikely).
Before we start, let us remember that until recently, commodities have been in a three year bear market and offer good value (especially on relative basis to DM stocks). Moreover, as Chart 2 clearly shows, investors have been underweight commodities for months on end. From a contrarian perspective, this asset class could surprise investors on the upside. Let us look at all of the sectors within the tradable Rogers Commodity Index (NYSE: RJI).
Chart 3: Commodities find themselves pressed against resistance line…

Source: Short Side of Long
Rogers International Commodity Index (RICI) is one of the most balanced indices when considering commodities as an asset class. The index weighting consists of 16% WTI Crude Oil, 13% Brent Crude Oil, 5% Natural Gas & Gold, 4.75% Wheat & Corn, 4.2% Cotton and 4% respectively for Aluminium, Copper and Silver. Many more commodities are apart of the index including Milk at 0.1% of the weighting.
While the overall index is attempting to break out above the technical downtrend resistance seen in Chart 3, it is prudent for us to analyse sub-sectors and individual commodities separately. This is commonly done with stock market analyses, where an investor focuses on various sectors (cyclicals and defensives) and overall market breadth.
Chart 4: Commodity energy sector seems to be reacting to events in Iraq

Source: Short Side of Long
On Friday, I alerted the readers that Brent Crude Oil is staging an upside breakout from a prolonged consolidation. Around the same time, Crude Oil volatility was around record lows and it seems that the market was just waiting for a potential catalyst to move prices. It appears that recent developments in Iraq and Middle East have pushed Oil up strongly this week. This is best reflected in the Rogers Energy Index, where a breakout took hold posting 52 week new highs. Let us remember that Oil is a major barometer of economic activity and a sudden spike in prices usually tends to slow down growth.
Therefore, from the global growth aspect, a rise in Oil prices could also pour cold water on theextremely bullish sentiment seen on the equity market, together with exceptions of strong earnings and GDP growth. From the other aspect, policy makers from every major central bank to IMF and World Bank are fearful and worried of deflation. Quite to the contrary, a spike in Crude Oil prices could actually create an upside surprise in inflation… a complete opposite to the consensus. I mean, when was the last time IMF or World Bank got anything right anyway?
Finally, both of the other two commodity sectors have not yet responded in similar fashion to the Energy prices (refer to Chart 5 & 6 below). As already stated on the blog before, if the current commodity rally is to have legs, it will need to be firing all cylinders. That means Agriculture and Metals will need to join the party, broadening the breadth advance of the Rogers Commodity Index.
Chart 5 & 6: Agriculture and Metals have not yet followed Energy higher


Source: Short Side of Long