Precious Metals Sentiment
Great Post from the Short Side of Long:
I’m not really sure if you want to classify Gold and Silver as commodities or currencies – that is upto you. I am a strong believer that these two assets are in a secular bull market that will eventually go so high, even I will be surprised… and I am a super bull here! Obviously, I am talking from a secular timeframes – which means we started in 1999/2001 and we still got several years of rallying left or even towards the end of the decade.
Therefore, the goal of an investor (not a trader) is to buy into a long term uptrend or secular bull market and hold, where others are selling and extremely bearish. That is what a contrarian does. Sometimes people mistake contrarian analysis for trading against the trend just because majority are bullish in a bull market, but it is those times that sentiment indicators work less reliantly. There is no point in trading against trends – majority of the time you just get killed. Trading with the long term trend, but being contrarian against majority… that is where large success can be found and we could now be close to one of those moments in precious metals. Lets have a look…
Futures Positioning
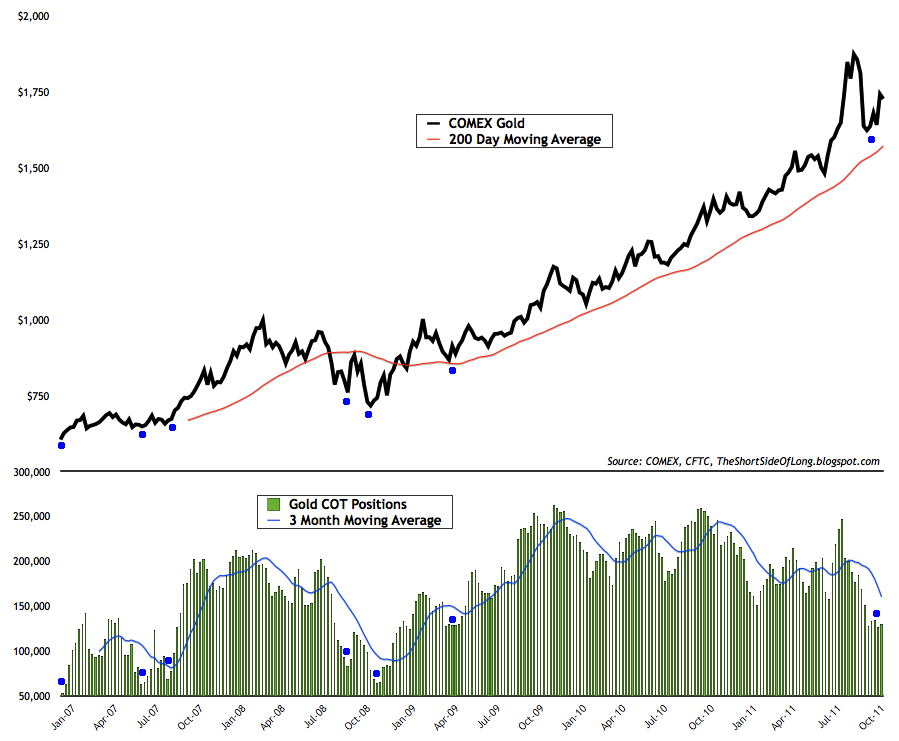
We will start with Gold first. The chart above shows Gold positioning commitment from Speculators on the COT reports, released every Friday. As of last Friday, readings show 129,721 contracts net long. Previous Fridays readings were 126,978 contracts net long. This is now the lowest bullish exposure in Gold since March and April 2009 – before Gold started its mega rally above $1000. What we have here is a 50% reduction in exposure from the recent bullish extremes of 247,175 net long contracts reached in August of this year.

The next chart along shows Silver positioning commitment from Speculators on the COT reports, released every Friday. As of last Friday, readings show 11,022 contracts net long. Previous Fridays readings were 10,352 contracts net long. This is now the lowest bullish exposure in Silver since September 2007 – just before Silver starts its rocket fuelled rally when it doubled from about $10 to about $20 in a space of a few months. What is interesting now is we have even less optimism on Silver than we did during Lehman Brothers collapse. Investors are really scared of this asset collapsing further, which is creating symmetric positioning potential.
Sentiment Survey’s
Gold’s Daily Sentiment Index (DSI) currently stands at around 60% bulls – quite a neutral figure giving us no edge. Having said that, the figure went into low teens just recently, when Gold collapsed to below $1,600. Public Opinion on Gold hit levels last seen in October 2008 and it is still around those levels today.
Newsletter service by Mark Hulbert, known as the Hulbert Newsletter Gold Sentiment Indexes, tracks net exposure that advisors are recommending their clients. As of 28th of October, these market gurus were recommending -6% exposure to Gold. If we compare this figure to the data in the previous six years, this is only the seventh time readings reached these low levels. The last time net short exposure was recommended was during March and April 2009, just before Gold started a super bull run.

Silver Public Opinion, a grouping of all major sentiment survey’s, is thanks to SentimentTrader website. I have to admit, when one looks at the chart above, one should really get a strong urge to buy Silver – I do everyday. Majority are bearish on this asset with passion… they really really hate it. They have hated it since it first started collapsing in early June and apart from a little pause in between, they are back to being overly negative about it. The recent sell off in late September, pushed this sentiment reading to a record low. That means we know have more bears than in October 2008 and yet the price is 3 times higher.
Funny isn’t it? That is what a secular bull market does, as it climbs the wall of worry and wonder!
I am personally considering buying a lot of Silver very soon, but I am just waiting a while longer for all the fear to completely play and and for the Dollar to stop rallying. To be honest, judging by the chart above alone, I probably should have done so already, and maybe we have already bottomed. The volatility has been insane, so it has been difficult to buy that low I always search for.
Fund Flows
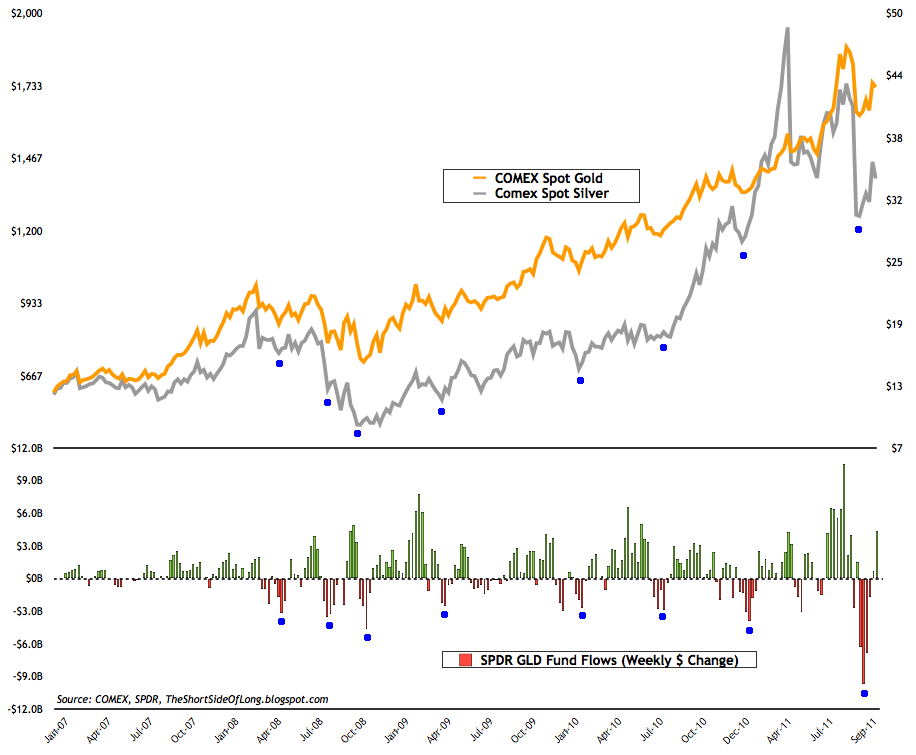
I tend to use GLD weekly dollar change fund flows for both Gold and Silver. I do have data from other ETFs including SLV flows, but it does not work anywhere as good. Besides, Gold and Silver have an amazingly high correlation, so it is pretty useful for both assets. Looking at the chart above, coming into late September, GLD suffered a record weekly outflow two weeks in the row. This was a selling climax or a panic or fear or whatever you want to call it. Previous outflows only half of the recent amount have resulted in intermediate bottoms, so it is safe to assume this time will not be different. We could be in for one more sell off for a retest of lows. If that happens, jump in with both hands and feet against the crowd!
Options Positioning

I have to apologise as this chart is outdated by about a week or two. But what I am driving at here is the astonishing number of Puts bought as Gold hit $1,600 levels and bottomed. The bearishness really started to get out of hand as many retail investors expected Gold to continue lower. They were binge buying puts any chance they get or anytime prices went a tad lower. Do not get me wrong, the price still might make a lower low, but not when majority are betting on it… that is for sure.
Long Term Trend

Long term trend check is usually performed with various technical indicators. I prefer to use % distance away from the 200 day moving average. You can use whatever you like or whatever works for your style of investing/trading. One of the reasons I have been hesitant on precious metals, but especially Gold, is because the asset has not traded below its 200 day moving average for almost 3 years now. That is NOT normal. actually, that is quite a rare event in all honesty and does not last forever. Last time Gold gave a decent buy signal with this indicator was around middle to late 2008, as it was bottoming around $680 – $720.
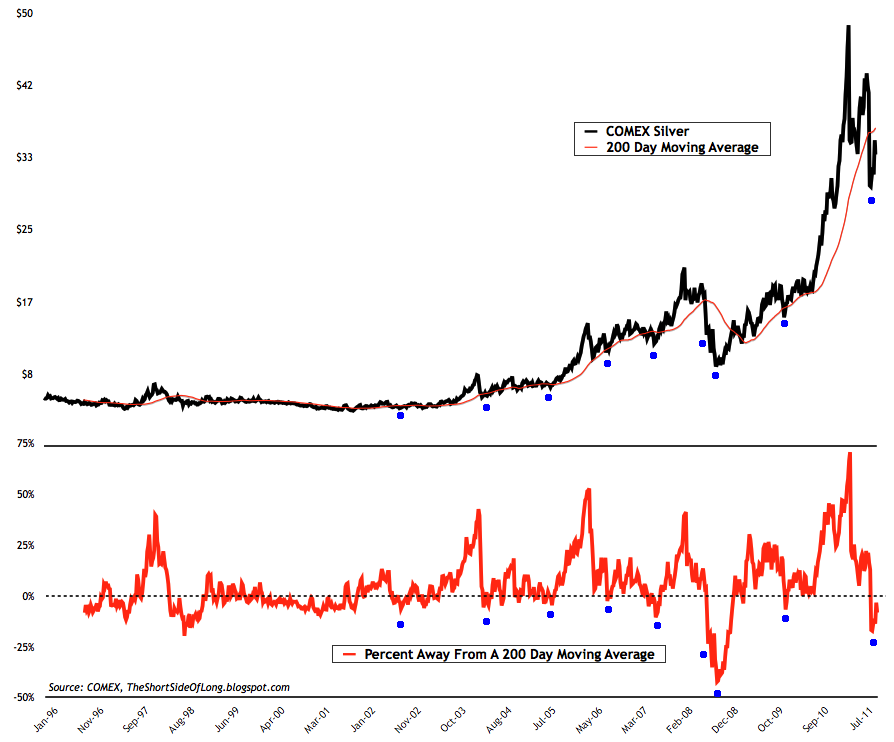 Silver on the other hand, has and still is trading below its 200 day moving average. This is actually the second worst oversold reading over the lasts decade. During 2008 amazing crash, Silver went over 40% below its 200 day moving average, which proved to be one of the greatest buying bottoms of the last cycle. This time is not as good, but long term investors should considering add here. If prices go lower, buy more!
Deflationist Outlook
Elliot Wave International, one of my favourite proxies for what perma-bearish deflationist crowd thinks (they are right sometimes mind you), are expecting a 5th wave down in this Silver sell off towards $23 an ounce or possibly even further. They also expect Gold to hit levels around $1,300 an ounce. I am not sure of what help this offers, but I can tell you that majority of the time, this group has been awful at calling future moves in Precious Metals. If they do get it right this time, despite such negative sentiment around, it will create a perfect buying opportunity in my opinion. Serious margin prices!
An unknown blog that I check from time to time, which is also a great proxy for perma-bearish outlooks, whose writer always tends to expect every sell off to turn into a 2008 repeat, recently mentioned that too many investors are still optimistic on Silver. Expecting lower prices, the blogger has been saying that he is loading up on long dated Puts on this asset class as of last Friday. Usually the noise from retail investors like these get very loud at the bottom.
Summary
Precious metals sentiment, especially towards Silver, is extremely negative. Be it from Commitment of Traders position, various sentiment indicators, ETF fund flows, put call ratios and many other tools, all point to a condition that is ripe for long term investors to buy or add to their positions – especially in Silver. Long term investors should also note that unlike Gold, Silver has yet to make a new record high exceed 1980 peak. There is a lot of value there!
Bearish Case
I have to admit, it is more linked to Gold than Silver, but those two partners in crime follow each other very well. First of all, Gold has not broken below 200 day moving average. This super trend activity will not last forever, it never does. Eventually a correction of serious magnitude comes about and pushes the price below this technical line – even if it is a sideways motion. That is when many panic, just like recently in Silver and that is also when we are presented with a great entry.
Another worry is that Gold is up 11 years in the row. I have struggled to find a main asset class throughout history, which has 11 years in the row, closed in the positive. This has been a remarkable run, but no asset class goes up year after year without having a correction or a consolidation rest. Be warned Gold bulls… history is not on your side here. Silver, on the other hand is now only up 3 years in the row after suffering a massive loss in 2008. As a matter of fact at one point Silver was down substantially this year too!