Gold Miners Nearing Strong Monthly & Quarterly Close
The gold and silver miners have cooled off in recent days after a red hot start to the summer. Could this cool off be the start of another move lower or a pause before another leg higher? We continue to be bullish and a new reason is the sudden strength in the monthly and even quarterly charts. For larger or developing trends, monthly charts supersede weekly charts which supersede daily charts. With only two days left, the gold and silver miners are poised to end the month and quarter with their strength intact.
If GDXJ, (shown below) can close June above $41.34 then it will achieve its highest monthly close in 10 months. At the least, GDXJ is set to close at a four month high in monthly terms while engulfing nearly the last three months of trading. Compare that to the monthly advances in July and August of last year and January and February of this year. Those gains were weaker in comparison. Moreover, the strong gains in June are confirmed by the explosion in the volume.
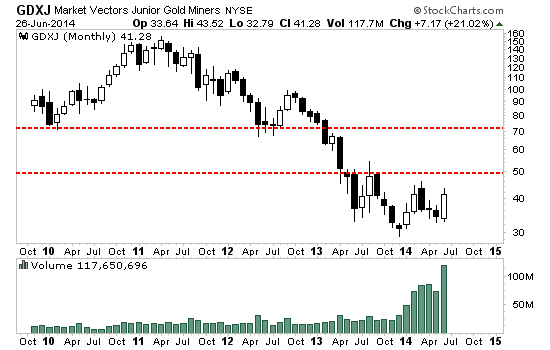
The monthly chart for GDXJ clearly shows long-term support and resistance. The May and June lows (~$33) are support while the next major resistance figures to be $50. In our last missive we mentioned that GDXJ’s next weekly resistance was $44. GDXJ’s June high is $43.52. Recent weakness and consolidation could continue in the short-term. I see support for GDXJ at $39 (and GDX at $24.75). Nevertheless, GDXJ has material upside from here to its next resistance at $50.
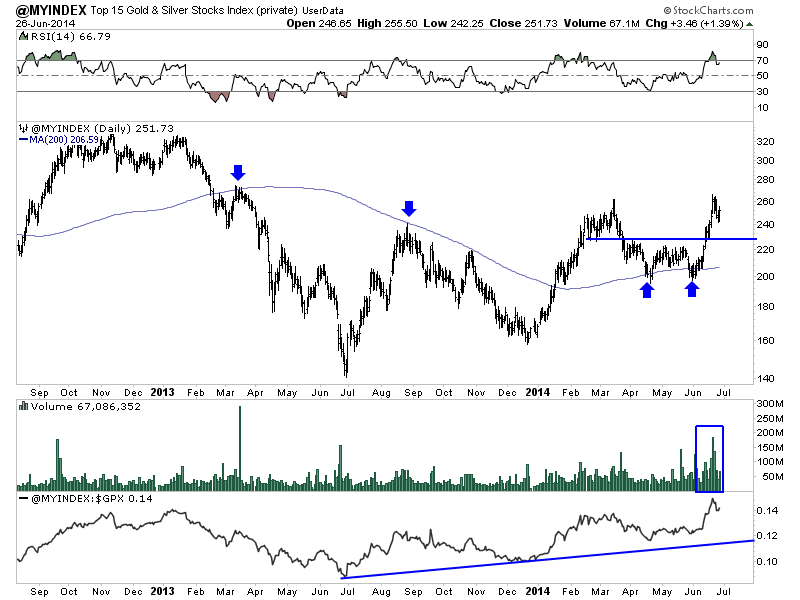
GDXJ is a proxy for the junior gold mining sector but I am not a fan for several reasons. It contains too many silver stocks, too many Australian based companies and some companies I would never consider buying. Stockcharts.com now allows subscribers to upload their own data and essentially create their own charts. Below is a daily chart of my top 15 index which hit a 16-month high last week. Note how the 200-day moving average was resistance in 2013 and is now support. The index could be forming the handle on a small cup and handle pattern that has potentially 27% upside from here. (That upside coincides with GDXJ’s upside to resistance at $50).
There are two takeaways from this article. First, the strength in the monthly (and quarterly charts) should confirm or at least strengthen the argument that the miners are in a new bull market. We have not seen this kind of strength (with volume confirming) to close a month or a quarter since this bottoming process began a year ago. It’s a signal that buyers are more comfortable holding their positions indefinitely.
Second, there continues to be strong upside potential for the sector in the months ahead. Our top 15 index shows the strongest companies are leading the way for the rest of the sector. Other than monthly resistance at $50, GDXJ has no major resistance until $70. Most of the upside potential remains ahead of us. With the big declines likely behind us, we think it’s wise to take advantage of dips in the short-term as we see potential for roughly 25% upside to Labor Day. We invite you to learn more about our premium service in which we highlight the best junior companies and trade and invest a real portfolio for subscribers benefit.
Good Luck!
Jordan Roy-Byrne, CMT