Is an Inverted Yield Curve Bullish for Gold?
In recent days we’ve seen the beginnings of an inversion in the yield curve.
The 2-year yield and the 5-year yield have inverted but not yet the the 2-year yield and the 10-year yield, the curve that is watched most. However, “2s and 10s” as bond traders would say appear headed for an inversion very soon.
We know that an inversion of the yield curve precedes a recession and bear market. That is good for Gold. But timing is important and the key word is precedes.
In order to analyze the consequences for Gold we should consult history.
First let’s take a look at the 1950-1980 period.
In the chart below we plot the Barron’s Gold Mining Index (BGMI), Gold, the Fed funds rate (FFR) and the difference between the 10-year yield and the FFR (as a proxy for the yield curve).
The six vertical lines highlight peaks in the FFR and troughs in the yield curve (YC), which begins to steepen when the market discounts the start of rate cuts. A steepening YC is and has been bullish for Gold except when it’s preceded by inflation or a big run in Gold.
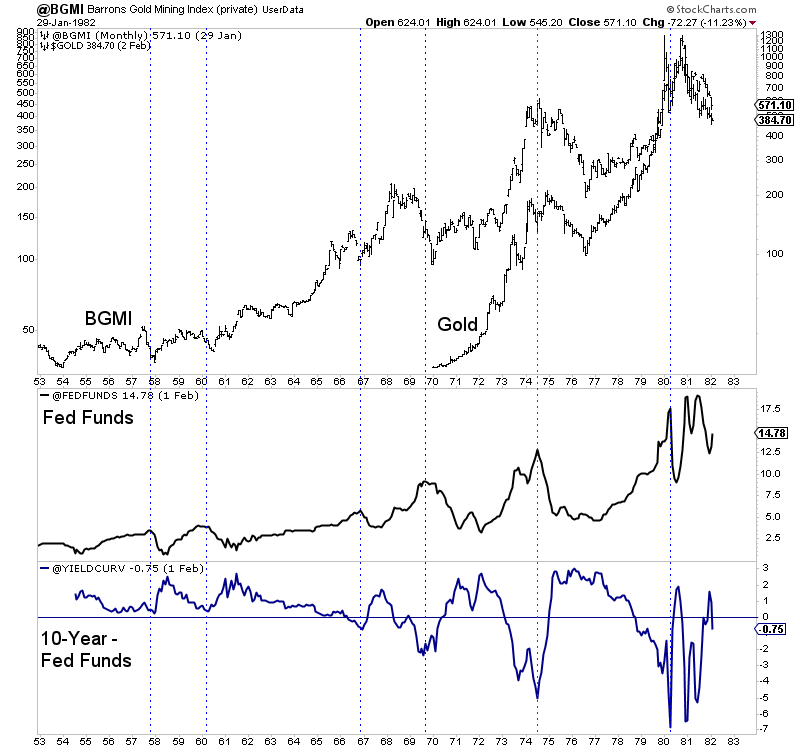
Note that five of the six lines also mark a recession except in 1966-1967.
At present, the yield curve is on the cusp of inverting for only the third time since 1990.
The previous two inversions in 2000 and 2007 were soon followed by a steepening curve as the market sensed a shift in Fed policy.
The initial rate cut in 2000 marked an epic low in the gold stocks and the start of Gold strongly outperforming the stock market. In summer of 2007 the rate cuts began and precious metals embarked on another impulsive advance.
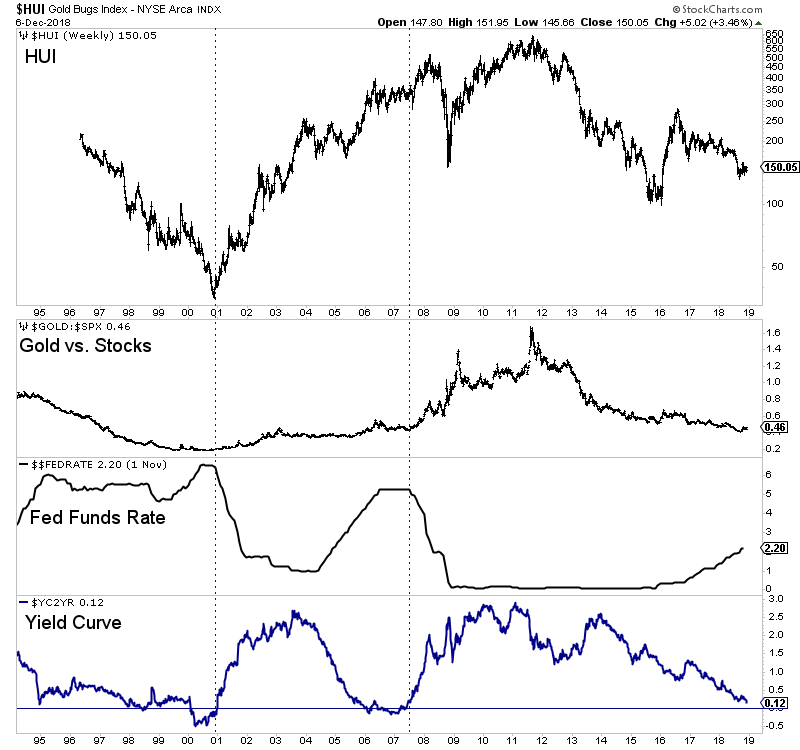
The historical inversions carry a different context but the takeaways are not so different.
Aside from the mid 1970s to the early 1980s, we find that a steepening of the curve (which accelerates from the start of Fed rate cuts) is bullish for precious metals. (This also includes a steepening in late 1984 that preceded the bull market in the mid 1980s).
With that said, the inversion itself is not bullish for precious metals because there can be a lag from then to the first rate cut and steepening of the curve.
I took a careful look at four of the previous inversions and counted the time from that point to the next significant low in gold stocks. The average and median time of those four is 10 months.
That appears to be inline with my thinking that the Federal Reserve’s final rate hike will be sometime in 2019.
In the meantime, precious metals are rallying but the inversion of the yield curve and Fed policy argue it would not be wise to chase this strength. There will be plenty of time to get into cheap juniors that can triple and quadruple once things really get going. To prepare yourself for an epic buying opportunity in junior gold and silver stocks in 2019, consider learning more about our premium service.