Major Bottom in Precious Metals Could Occur This Week
Normally catching a bottom is not difficult. Bottoms tend to occur instantly while market tops form during a process. Yet, I’ve found that bottoms of long-term significance do not occur instantly. Like tops, they can take time to develop. For example, think about late 2008 to early 2009. Commodities hit their price low in December but the bottoming process began in October and wasn’t complete until May. Emerging markets hit their low in November but the process began in October and ended in March. Returning to the present, we see that Gold and Silver look set to retest their late December lows. Our work leads us to argue that the metals will successfully retest their lows and soon emerge from what in the future will be considered a major bottom in-line with 2008, 2005 and 2001.
We begin with a daily chart of Gold which shows its daily closing prices and a volatility indicator. The percentage figure refers to the percent bullish reading from the daily sentiment index. As we noted recently, each bottom in Gold (except 2008) has come during a period of low and declining volatility. Volatility is currently at a 9-month low while only 7% of traders are bullish on Gold.

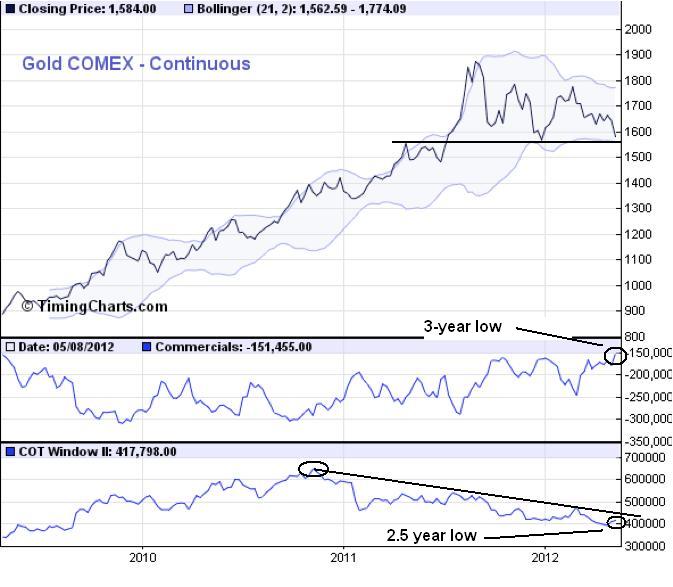
Next, let’s take a look at the current Commitment of Traders Report (COT) for Gold which shows the commercial short position and open interest at the bottom. The current commercial short position has reached a 3-year low while open interest recently touched a two and a half year low.
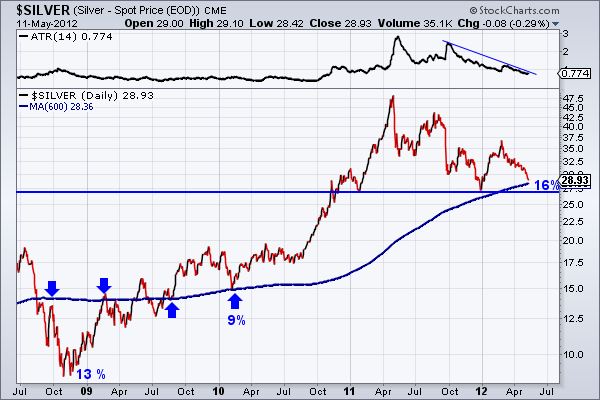
Moving to Silver, we see the metal is nearing significant support at $27. Silver closed at $28.93 and has a bit of room to fall before testing $27 and the 600-day moving average, which has been an important pivot point since late 2008. The current daily sentiment index is 16%. We think, with another day or two of weakness in Silver, the daily sentiment index would decline to single digits. We also want to note that $26 is the 50% retracement of the entire bull market.
Silver, unlike Gold, has seen more interest recently as open interest has increased since late last year. However, open interest would have to rise 40% to reach the old high. Commercial traders are net short 17.9K contracts, which is a within a whisker of the 10-year low which was reached at the end of last December.

We remain encouraged that a bottom is developing in the mining equities. Below we show a weekly chart of GDX. Last week GDX bounced from $41, which is the 50% retracement from the 2008 low to 2011 high. $41 also marks the strongest pivot point since $52. Furthermore, GDX’s volume was very close to a 3-year high. Note how strong volume has market past bottoms.

Breadth indicators suggest the gold stocks are near a major bottom. The chart below is from SentimenTrader.com. The McClellan Summation index is near levels last seen at bottoms in 2008 and 2006. The bottom row shows the percentage of stocks in the sector that closed above their 200-day moving average. The figure has been at zero percent for more than a month. The last time that happened? 2008.

The next chart, also from SentimenTrader.com, shows the assets in the Rydex Precious Metals Fund. Since the late 2010 peak, the fund has dropped by 40% while the assets in the fund have declined by 70%! Interestingly, the assets in the fund declined by 70% in 2008. The difference is the fund’s price declined by 73%. In other words, we are seeing the same amount of outflows as in 2008 yet the market has declined by 40% and not 73%.

While technical analysis and sentiment indicators make a convincing case that a major bottom is near, it is important to note the fundamental considerations which support our thesis. In recent editorials we’ve noted the trend of weakening data in the US. Obviously, should it continue into the summer, then it would raise the odds of Fed action. Shifting east, Europe is headed for a recession and monetization is badly needed first to prevent debt contagion and second to prevent economic contagion. Germany, the lone hold out against monetization, indicated last week it might budge a little bit. Continuing eastward, China cut the reserve ratio for its banks and is likely to do so again reports the Wall Street Journal. Also, India and Australia recently cut interest rates.
Consider these emerging fundamentals and then consider our technical analysis. Technicals always lead fundamentals and markets tend to look six to nine months into the future. We are not predicting imminent action from the Fed or imminent money printing from the ECB. However, we are noting the emerging positive developments which will drive precious metals higher into 2013. Policy from the east is shifting towards easy. Europe will have to embark on some major money printing likely by the end of the summer. Finally, continued weakness in US data along with the strength in US Bonds and the US Dollar will facilitate the environment for the next round of Fed action.
We anticipate a bottom this month to be followed by a higher low in July or August. The fundamentals should become more clear by the end of the summer and would drive the precious metals complex much higher during the seasonally strong period. Remember, major bottoms take some time to develop. We believe a bottom is at hand and that is why last week we began to scale into some positions. If you’d be interested in professional guidance then we invite you to learn more about our service.
Good Luck!
Jordan Roy-Byrne, CMT
Jordan@TheDailyGold.com