Misreading the CoTs, Again
Nearly two months ago I published a video in which I discussed conventional CoT analysis and the mistake many investors might make assuming Gold and gold stocks would undergo a big correction. The fact is a bull market that follows a nasty bear usually stays very overbought throughout its first year and therefore sentiment indicators remain in bullish territory. As a result of the primary trend change, conventional CoT analysis fails and requires an adjustment. Today we look at the Gold and Silver CoT’s while harping on a few of the mistakes people are making.
The first mistake people are making (and I’ve seen this quite a bit recently) is painting the commercial traders as smart money. This completely mischaracterizes that group. Commercial hedgers are the users, producers or consumers of the commodity. They are using the futures market to hedge in some way. As Steve Saville writes in his explanation of the CoTs, the commercials usually do not bet on price direction. Generally speaking they tend to fade the trend while speculators drive or follow the trend. Risk certainly rises for bulls when speculators increase long positions aggressively and we should be aware of that. However, we should look beyond nominal figures to get a better reading of the degree of speculation.
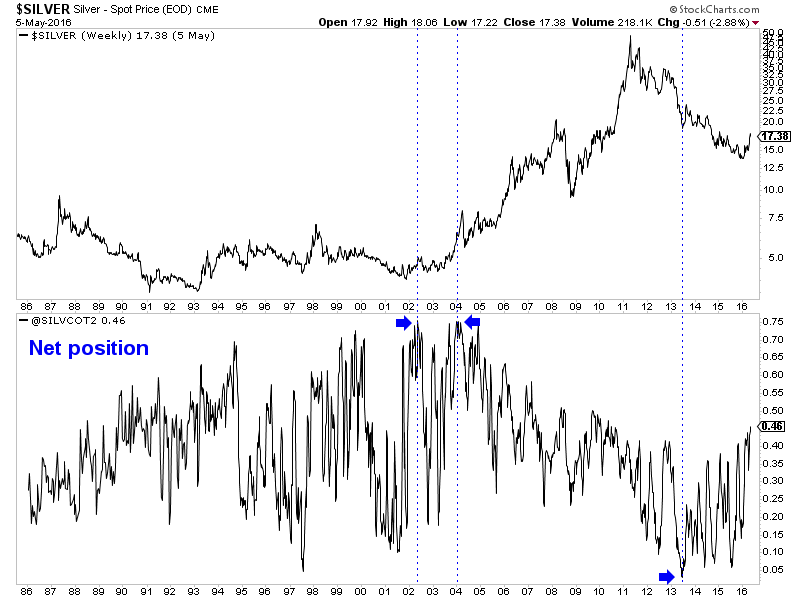
The second mistake is looking at the CoT’s in only nominal terms and not as a percentage of open interest. The nominal net speculative position in Silver is at an all time high, which sounds scary. However, as a percentage of open interest the net speculative position is nowhere close to an all time high.
In the chart below we plot Silver and its speculative position as a percentage of open interest. The current position is 45.7%, which is nowhere near the all-time highs seen in 2002 and 2004 of nearly 75%. Also note how the net speculative position does not tell us anything about the primary or long-term trend. Speculators were most bullish in 2002 and 2004 just after the start of a secular bull market. Speculators were least bullish in 2013. Silver bounced but continued to make new lows for a few more years!
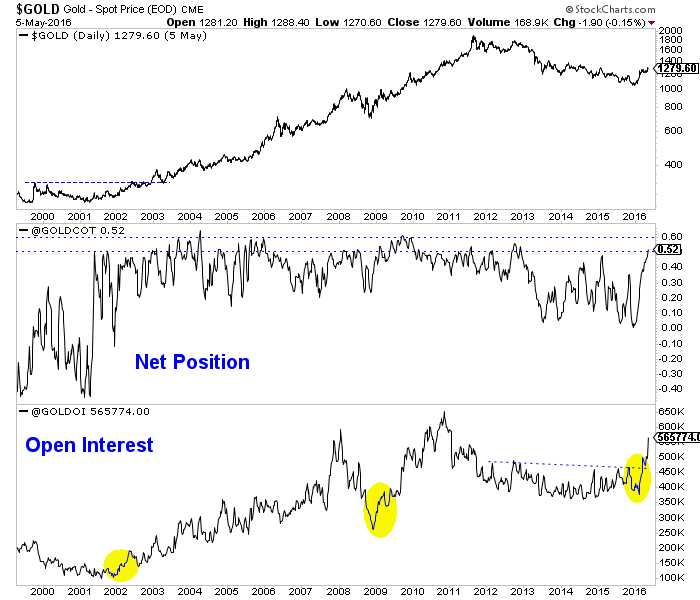
When considering open interest, Gold’s primary trend change has been confirmed yet the net speculative position in Gold is much closer to extremes than Silver’s. Take a look at the chart below and note the huge increases in open interest that immediately followed the lows in 2001, late 2008 and late 2015. A rise in open interest confirmed the trend change at those points. As of Tuesday, the net speculative position in Gold was 52.1%. Note that from 2003 to 2012 the net speculative position often peaked at 55% to 60%. Keep in mind, we do not know if Gold’s next peak will be at 55% or even 70%.
Overall, the CoT is one of a handful of tools we use and we learned how to interpret and analyze it the hard way. Remember, the speculators drive the trend and it’s best to judge their position in terms of open interest. I do not see anything in the CoTs or price action of the metals or the miners that says they are about to endure a large correction. That will change at somepoint but for now weakness or consolidation is a buying opportunity. Consider learning more about our premium service including our favorite junior miners which we expect to outperform in 2016.
Jordan Roy-Byrne, CMT
Jordan@TheDailyGold.com