Dollar At A Critical Juncture
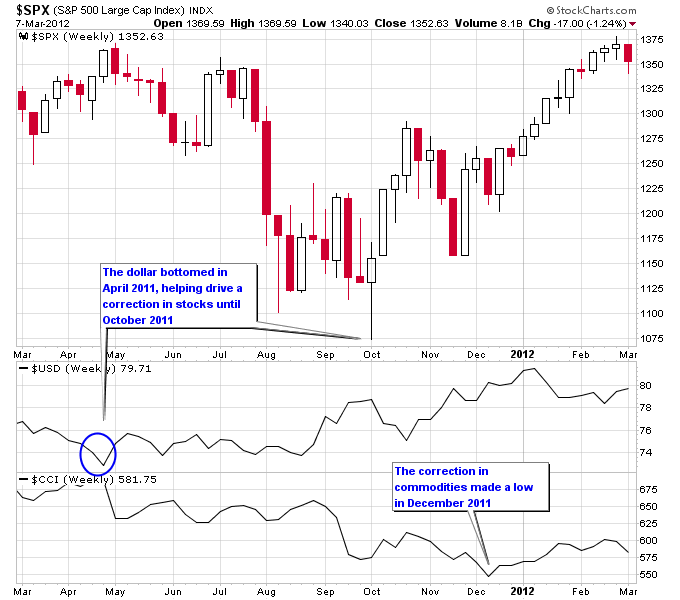
As we go through the first significant pullback in the market for 2012, the dollar seems to be at a turning point that should influence market trends for the next few months. Going all the way back to 2002, there has been a strong inverse correlation between stocks and commodities, and the U.S. dollar. For the most part, the dollar has been falling during this period, which has helped drive cyclical bull markets in stocks and commodities. More recently, the stock market panic of 2008 and the first Euro crisis of 2010 drove significant countertrend rallies in the dollar, and corrections in stocks and commodities.
Almost one year ago in April of last year the dollar put in another significant bottom and has been rallying ever since. The stock market and commodities suffered while the dollar moved higher in 2011, until the stock market put in a bottom in October. Since October, the dollar and stocks have been rallying together, and commodities finally put in a bottom in December 2011. And so far in 2012, we’ve seen a marginally lower dollar, and moves higher in stocks and commodities.
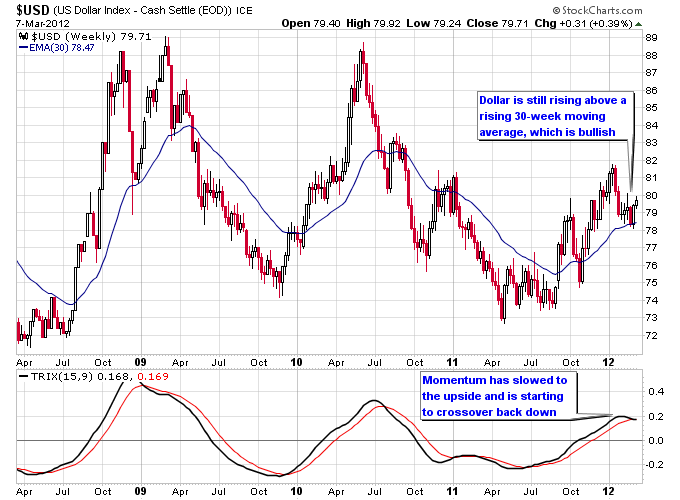
Now that we are at this pullback point in the market, the dollar clearly has a couple choices: 1) either go on to make new highs and most likely drive a deeper correction in stocks and commodities, or 2) fail to make new highs, and stoke a continued rally in stocks and commodities. Looking at a weekly chart of the dollar, from a Stage Analysis perspective the dollar is still rising above a rising 30-week moving average, which is bullish for the dollar. But momentum is clearly slowing to the upside, and both previous major rallies in the dollar failed when the TRIX momentum indicator rolled over to the downside on the weekly chart. Notice too that if the dollar rally were to fail here or close to here, each successive dollar rally since the panic in 2008 has carried less momentum to the upside.
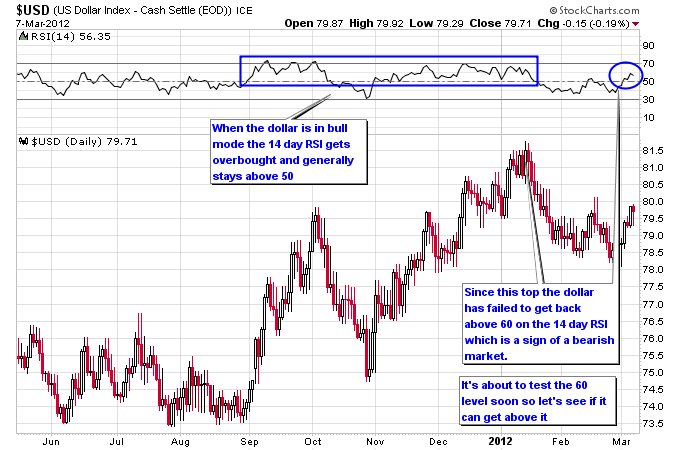
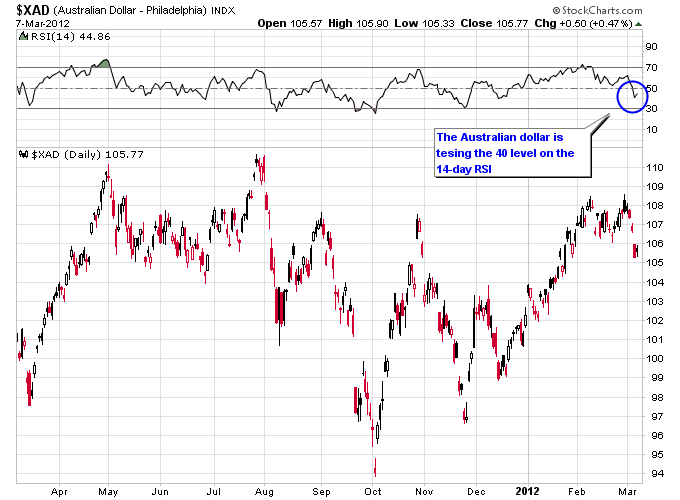
Another upcoming test for the dollar is whether it can get back into “bull mode” according to the 14-day RSI. The 14-day RSI is used by some technicians as a bullish or bearish indicator depending on whether it oscillates in a 80-40 range (bullish) or 60-20 range (bearish). This essentially is a representation of the strength of the trend. In a market strongly trending higher overbought readings above 70 occur more frequently and oversold readings rarely get below 40. Conversely in a bearish trend the market typically can’t get above 60 on a rally and spends more time oversold on the 14-day RSI with readings in the 20s or lower. On the current daily chart of the dollar you can see that the dollar was in bull mode up until the end of last year. But since then it hasn’t been able to get back above 60 on the 14-day RSI. A failure to retake that level on the RSI would be another signal of a weakening dollar.
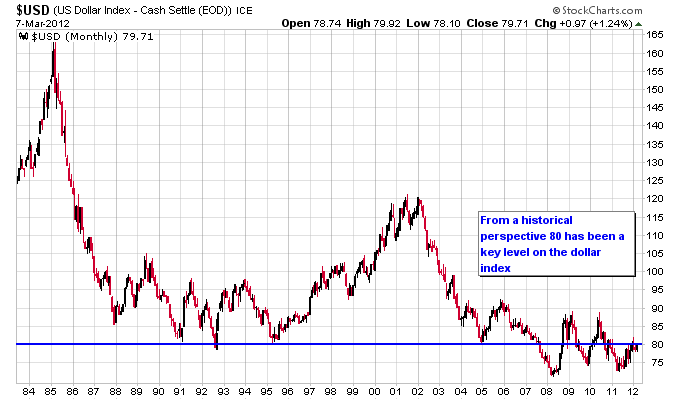
Going back multiple decades the 80 level on the dollar index has been a key level from a technical standpoint. Obviously the makeup of the dollar index has changed during this time period, but it would be pretty interesting if 80 held as resistance for the dollar here since support tends to turn into resistance once it is penetrated. There is also a confluence of resistance around the 85 level that repelled both the 2008 and 2010 dollar rallies.
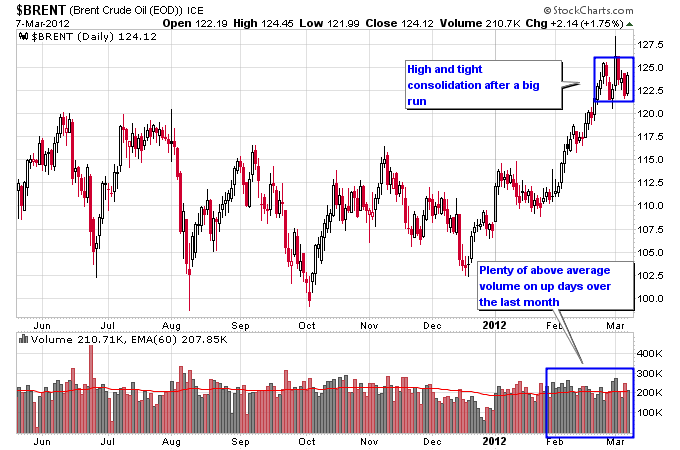
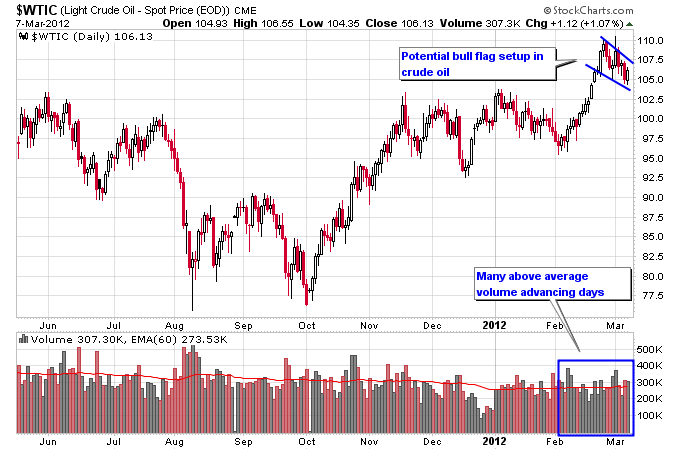
Switching gears a little, it’s often constructive to look at other markets to see if they provide corroborating evidence when formulating an opinion. Both of the charts of brent and west texas intermediate crude oil still look bullish, with recent breakouts on high volume. They both have also consolidated into tight flag patterns on the recent pullback.
Finally certain currencies such as the Australian dollar are trying to stay in “bull mode” with an upcoming test of the 40 level on the 14-day RSI. The Aussie is also poised to breakout to new highs if it can get back above 108 and stay above it.
Follow me on Twitter: @nextbigtrade
The original article and much more can be found at: http://www.nextbigtrade.com
The views and opinions expressed are for informational purposes only, and should not be considered as investment advice. Please see the disclaimer.
