Precious Metals Update (Long-Term)
Courtesy of Short Side of Long
In the first part of a two part Precious Metals Update, we looked at the way Gold, Silver, Platinum and other Precious Metal assets broke out above various technical resistance levels. We also covered sentiment and fund flows, while we discussed a huge short squeeze going on in GLD and SLV ETFs earlier in the month. All in all, the conclusion stated that:
“Precious Metals have come back into favour with investors recently, as market focus turns to the possibility of the Federal Reserve starting another round of Quantitate Easing or monetization of the US government debt. While no one can be one hundred percent certain Precious Metals have seen a major low, the technical evidence together with a potential fundamental trigger, do speak of positive price action ahead.”
Regardless of whether we have seen a major low or not, in the second part of the update I would like to focus on the long term Precious Metals picture, while eliminating short term market noise. So to do that, we should re-focus on why we are investing into Precious Metals and how to value the asset. Let us begin:
Everyone has their own reasons for investing in a certain asset class, but instead of covering them all and getting side tracked, I will just explain the reason why I invest in the Precious Metals sector. I have my own wealth and also the wealth of my clients to manage. These people have worked hard for the last few years to acquire, save and create their wealth. Their main priority, as well as my own, is not to lose it. In these uncertain times with high volatility and limited growth, the basic linear way of thinking is that the safest investment would be cash. After all, that is usually considered the most risk-free asset class.
While conventional wisdom like that might hold some truth to it, one has to pay close attention to current events (and also those throughout history), because one of the easiest ways to lose wealth during turbulent economic periods, is through monetary devaluation or money printing. You see, in plain English, global central banks throughout history have always tried to stimulate economies via currency devaluation during periods of low economic growth. They have always failed, because printing money does not create prosperity, but nevertheless they always seem to have “another crack at it” and this time is no different.
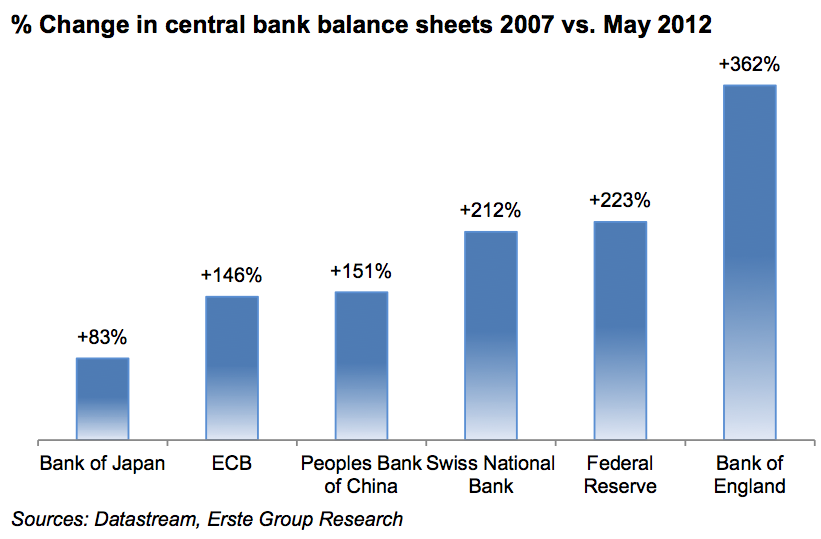
The chart above shows major central bank balance sheet expansions from the beginning of the Global Financial Crisis in 2007. Do keep in mind that the chart is slightly outdated, because in recent times the Fed, ECB and BoJ have all announced new “money printing” programs. Federal Reserve’s QE∞ (infinity) has already started as of last Friday and plans to print money until the unemployment rate moves below 7% and closer to 6% in the US. In other words, the printing of money will continue as far as the eye can see. It is during these periods that Precious Metals like Gold and Silver retain their purchasing power and act as an alternative currency to the fiat paper system. In Human Action, on page 401, Ludwig von Mises states that:
“Money is a medium of exchange. It is the most marketable good which people acquire because they want to offer it in later acts of interpersonal exchange… This is its only function. All other functions which people ascribe to money are merely particular aspects of its primary and sole function, that of a medium of exchange.”

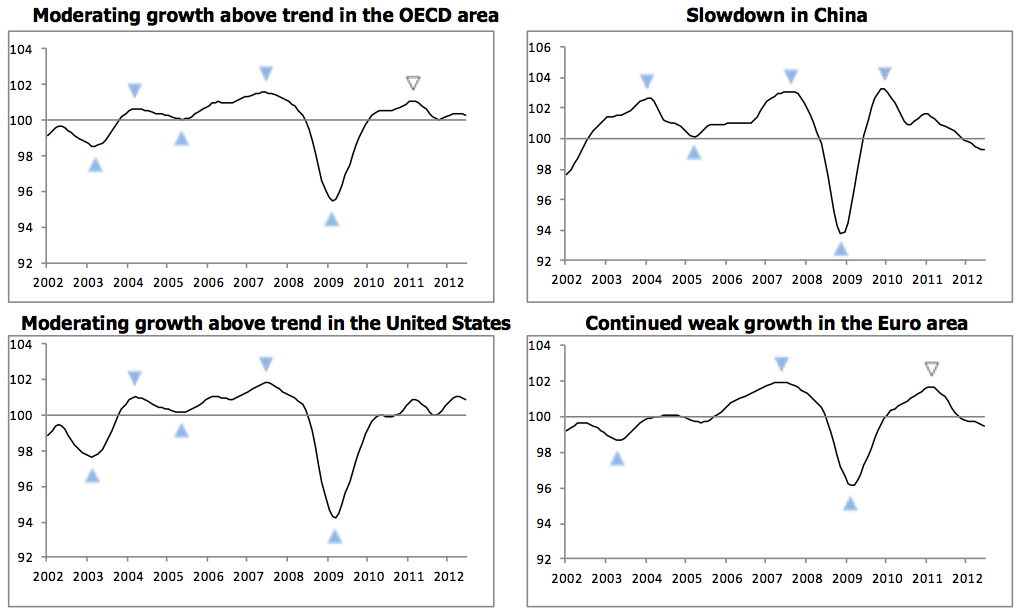
- OECD’s Leading Economic Indicators are contracting in all major Developed and Emerging economies apart from US and Japan, both of which now show growth slowing rapidly
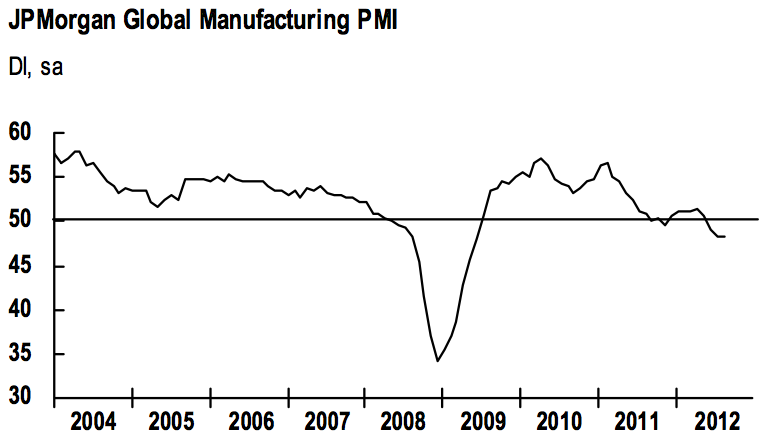
- Global Manufacturing PMIs are in contraction when it comes to all major Developed and Emerging economies, with the downtrend intensifying in the Eurozone as of yesterday
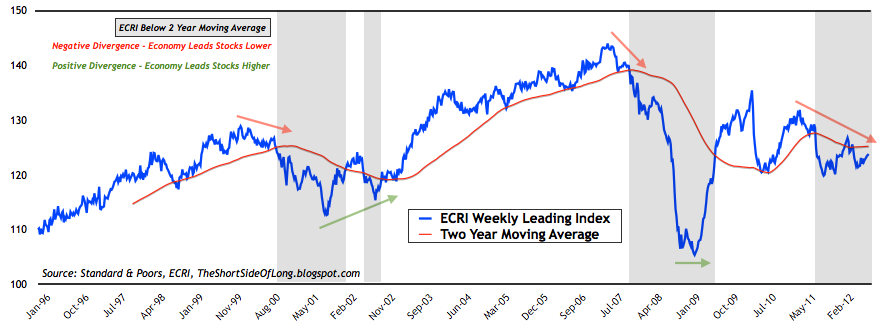
- ECRI’s Weekly Leading Index continues to display anaemic performance at best, even with trillions and trillions of stimulus via central banks and government deficits
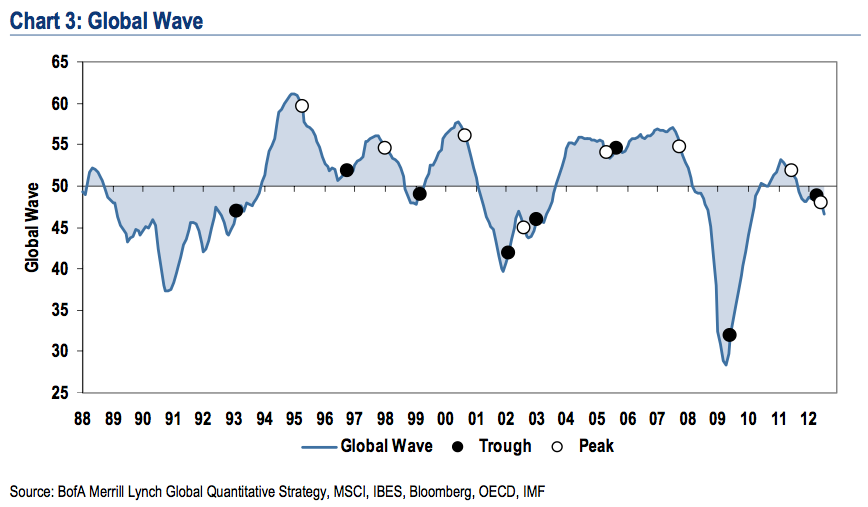
- Merrill Lynch’s Global Wave shows that the most important economic data from all major global economies is pointing to another slowdown or even the beginning of synchronised recession
- Global Business Confidence, Railroad & Air Cargo Traffic, Falling Company Revenues / Profits plus many other leading indicators, all point to stall speed growth

“Looking at the outstanding debt for the top 10 combined shows that just between now and the end of the year more than $5 trillion in debt will mature, or 17% of their total outstanding debt, and by 2015 nearly 50% of the top 10 debtor nations total outstanding debt will come due. That is more than $15 trillion in debt coming due in the next two and half years!
Because we are going to see trillions and trillions of sovereign debt come due over the next two and a half years I believe gold may be entering the mania phase of its secular bull market that began in 2001. There is just too much debt maturing over the next couple of years for capital markets to absorb and it is highly likely we will see global quantitative easing occur as central banks step in to be buyers of last resort to help suppress interest rates and keep debt servicing costs low.”
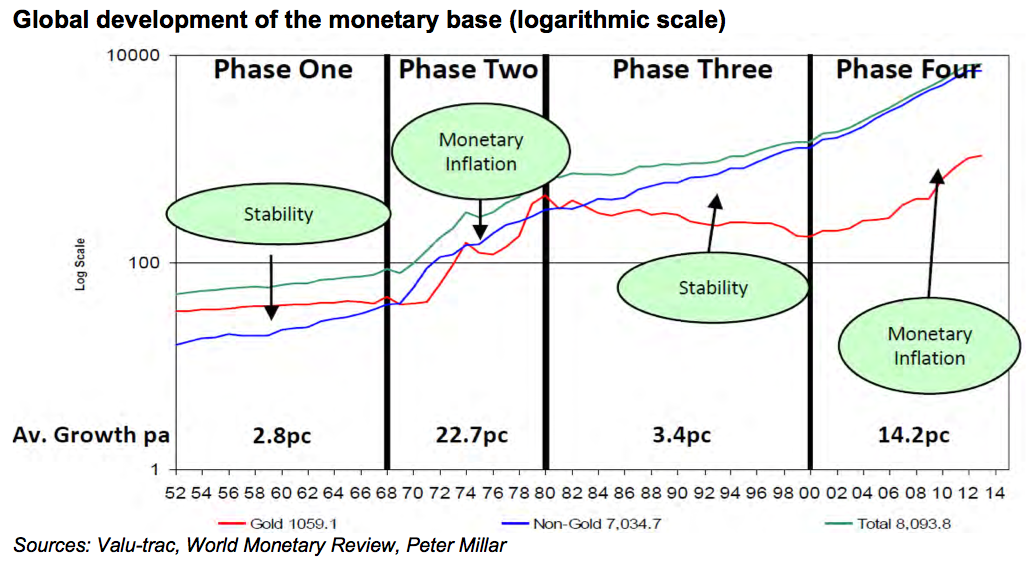
Interestingly, not only Mr Puplava, but quite a few other wise investors talk about Gold’s “mania phase” as the main reason they continue to stay long this asset class. Basically, to simplify the theory and eliminate a lot of when, why and what, we are currently in an inflationary monetary phase, as opposed to a stabilising monetary phase (chart above). What usually occurs during monetary inflation (fancy world for currency devaluation) is that Gold tends to move rapidly higher in value until it reaches a price where it essentially backs the monetary system. This historical phenomena which occurred in 1933 and in 1979, is created through investor fear, a primary component of human emotion which tends to spike Gold prices towards dizzying heights. Based on the monetary expansion by central banks, if Gold was to back the system as of today, the price would essentially rise towards $8,000 per ounce.
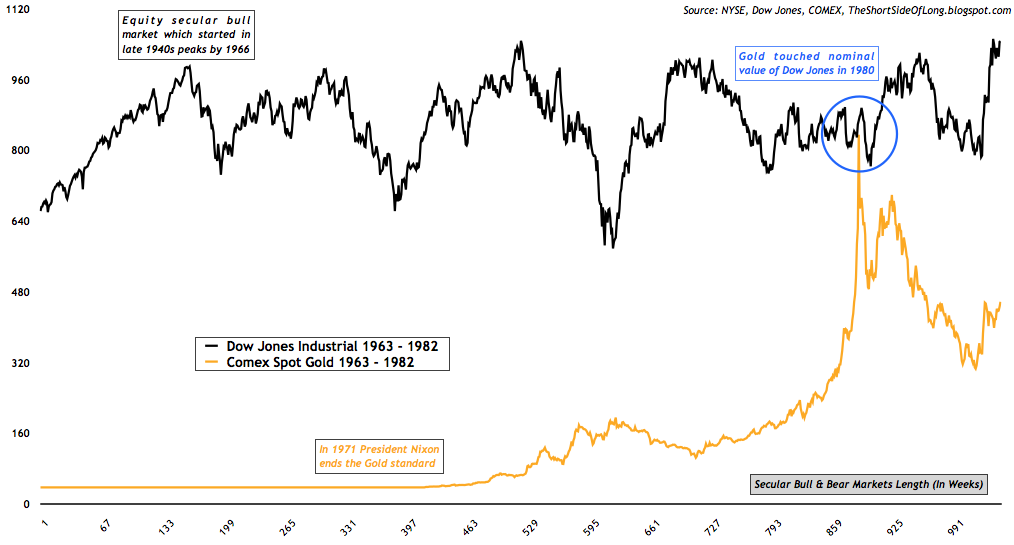
Moving away from Gold’s valuation linked with the monetary base, we turn to valuing Gold relative to other financial assets such as stocks. Personally, this is a much more preferred measure, because market participants buy and sell these assets everyday (free market). In the chart above, we can see how Gold and the Dow Jones Industrial performed in nominal price during the 1970s. While equities stayed flat for more than a decade, Gold entered a “mania phase” in the latter parts of the 1970s and then went parabolic into 1979, and finally touching the nominal value of the Dow Jones in the early parts of 1980.
True die hard Gold bugs will argue that we are in for a 1:1 Dow Gold ratio again. Rather than try to guess what will happen in the future, I prefer to leave that to weather forecasters, card readers, crystal ball fortune tellers and astrologists. I am not the one to agree or disagree, but if this event was to occur in a similar time span as during the 1970s, then Gold has a lot of catching up to do, because today the Dow Jones Industrial trades at 13,597 points. Even if the Dow Jones was to experience a 30% bear market, which is quite possible during a secular sideways trading range just like the 1970s, Gold would still have to reach at least $9,500 per ounce to arrive at the 1:1 ratio.
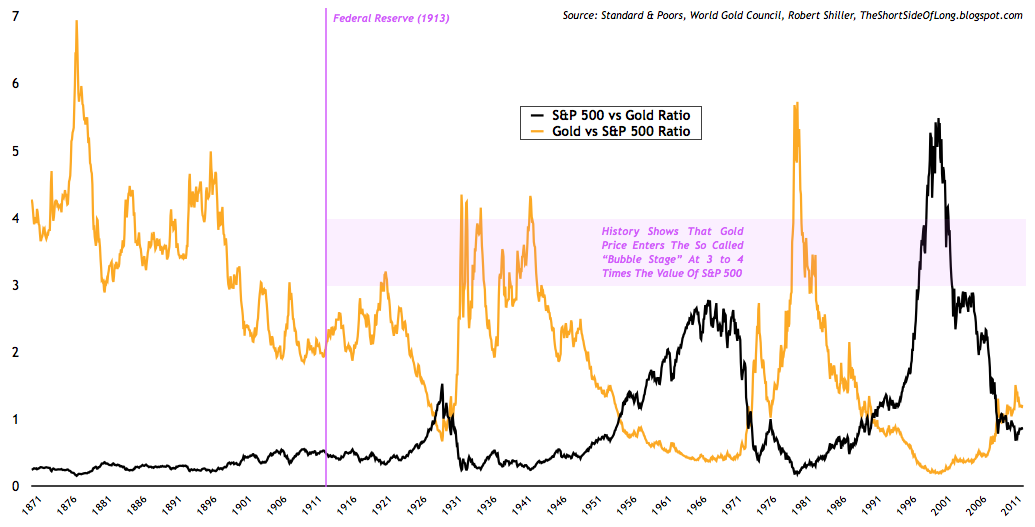
Another way to value Gold relative to the stock market is comparing the ratio of S&P 500 and Gold. Because most investors only look at one side of the ratio, S&P 500 vs Gold (black line), they easily arrive at a conclusion that stocks are extremely cheap relative to Gold as of today, and therefore Gold must be extremely expensive. This could not be further from the truth. Since every story has two sides, one cannot just focus on one and disregard the other. By simply switching the ratio over to Gold vs S&P 500 (gold line), we can see that Gold is extremely undervalued relative to the S&P 500. Overvaluation tends to occur when Gold trades at 3 to 4 times the value of the S&P 500, however in 1979/80 mania it went as far as 6 times the value. Today, the S&P 500 trades at 1,460 so even if stocks were to experience a 30% bear market (as already stated above), Gold could move towards $4,000 per ounce. Higher targets could occur if the ratio was to move to 6 times or more.
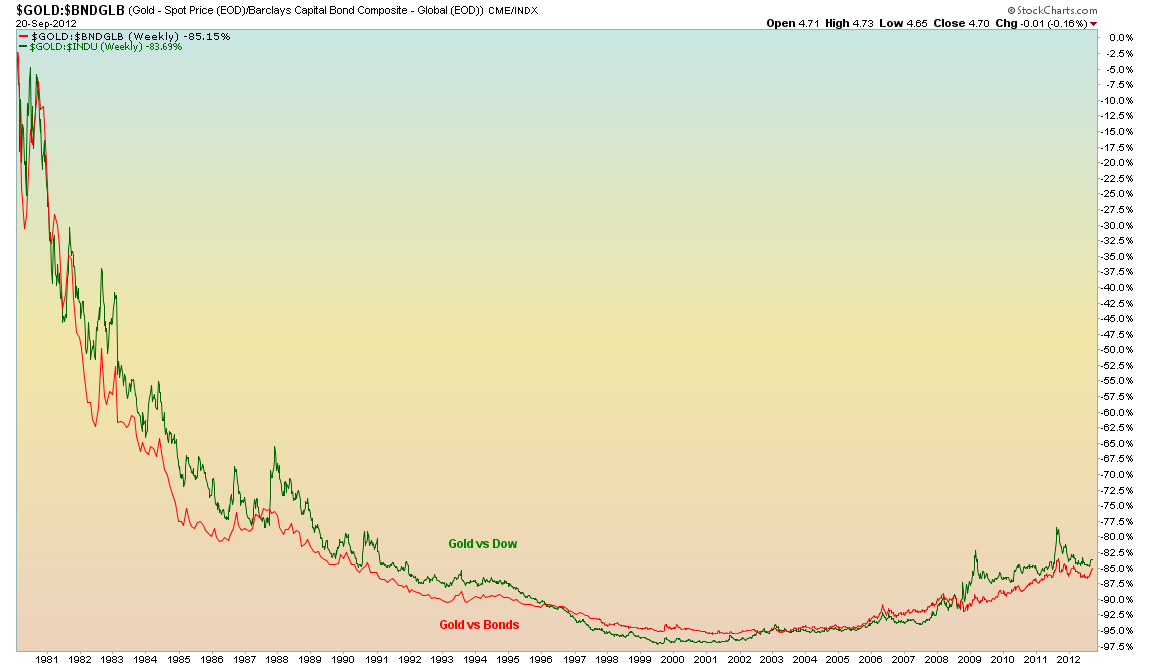
However, stocks are not the only overvalued asset class, relative to the last Gold peak in 1980. Bonds, which have experienced a super powerful secular bull market since 1981, are also extremely overvalued relative to Gold (even more so than stocks). The chart above shows just how cheap Gold is relative to its 1980 nominal ratio against Stocks and Bonds. If you are a believer that Gold will spike back to its former glory days of the late 1970s, then in percentage terms Gold is still more than 80% below its ratio all time high. That is still extremely cheap, despite Gold rising 500% in the last 11 years!
“The Pareto distribution (80/20 distribution) describes the statistical phenomenon of an uneven distribution that can be seen in many areas (e.g. in the distribution of income). Interestingly, it can also be applied to bull markets: 80% of the price performance tends to occur in the last 20% of the trend. The third and last phase is the phase of euphoria and ends in a “blow-off”, i.e. a parabolic increase. It is dominated by excessive optimism and a “this time it’s different” attitude. Gold would probably be increasingly traded in backwardation during this phase, which would be a clear sign of a buying frenzy. At the end of this cycle the smart money will have distributed.”
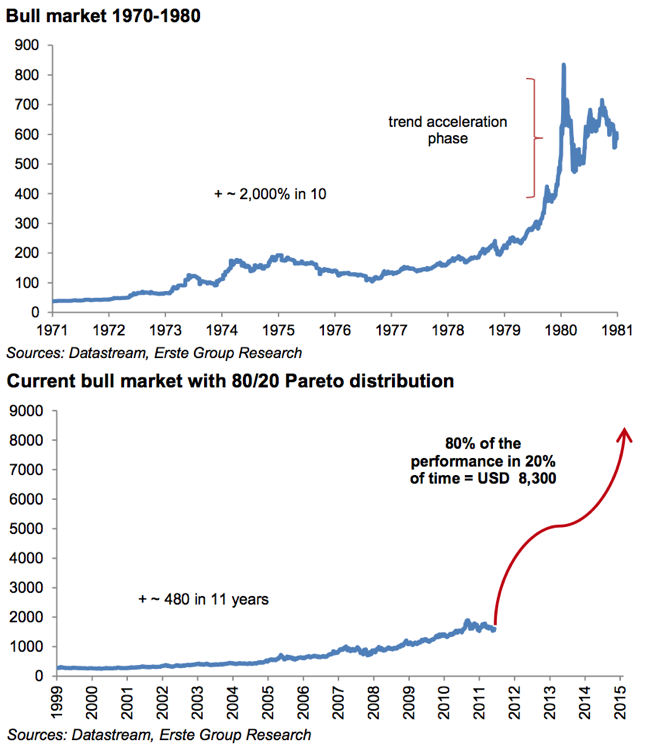
The chart above explains that quote from the report rather well. If the price action was to track the Pareto distribution, or also known as the 80/20 rule, then we could expect some serious Gold movements in the coming months, quarters and years as we witness a fast parabolic movement towards the sky (and much higher). In the last several years of this secular bull market, Gold could accelerate rather quickly and approximately hit a target of $8,000 per ounce or even higher, according to the chart above.
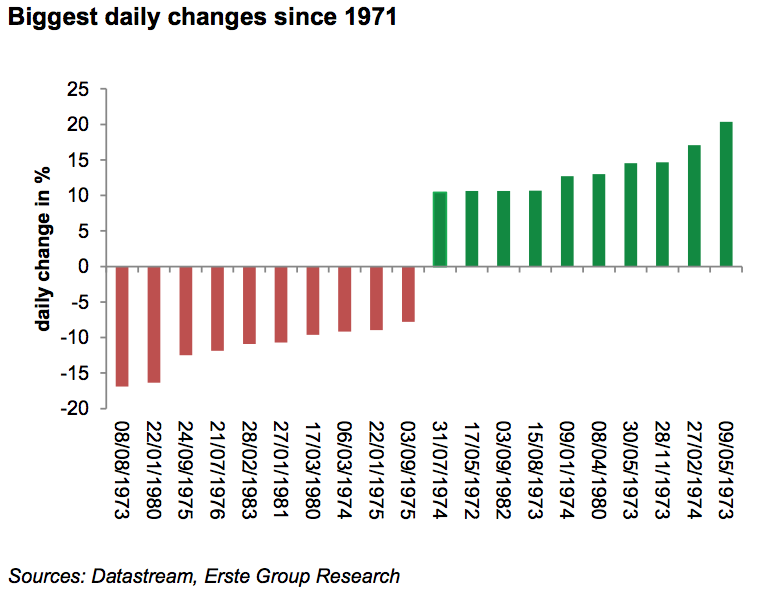
While we can talk about the Precious Metals bull market for days on end, especially if true die hard Gold bugs are present in the discussion, the main point is that Precious Metals are still a good investment today. Furthermore, in my opinion we haven’t even seen the major phase of the current secular bull market just yet. If you consider the chart above, you can see that all of the largest daily percentage changes on both the upside and downside occurred during the last great bull market of 1970s. Days when we see Gold rise 5% or even 10% in a single day are still in front of us. Consider that these prices movements could be $100 to $300 per day in the future. These will be the days when retail investors and dumb money, as well as all the current bull market disbelievers and remainder of the general public, start piling into Precious Metals.
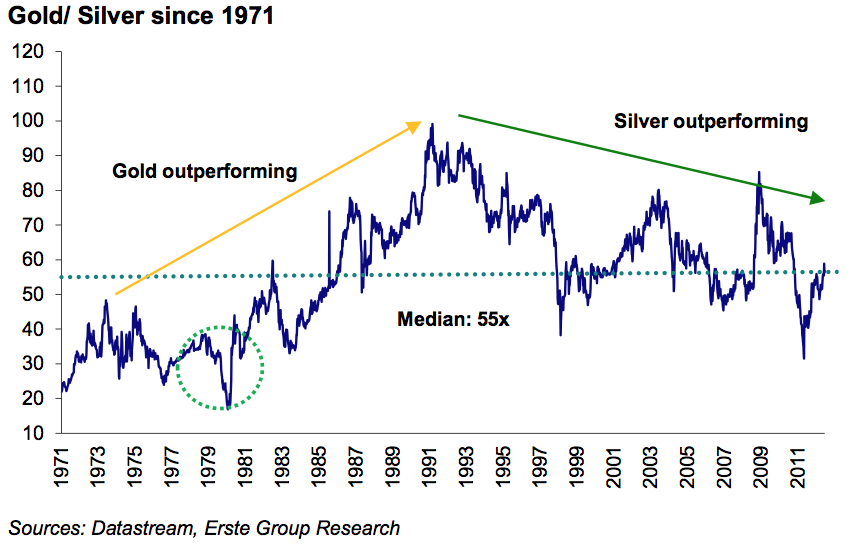
Finally, the question that I get asked all the time regarding my Silver investment – how high could it go? The short answer is I do not know, but the longer answer would state that if history is any guide, Gold’s smaller cousin Silver, could move towards its historical ratio of at least 16 Silver ounces for 1 Gold ounce. You can do the maths yourself…


