Silver COT Charts
Here are four charts that breakdown the Silver COT. Data is a week old so keep that in mind.
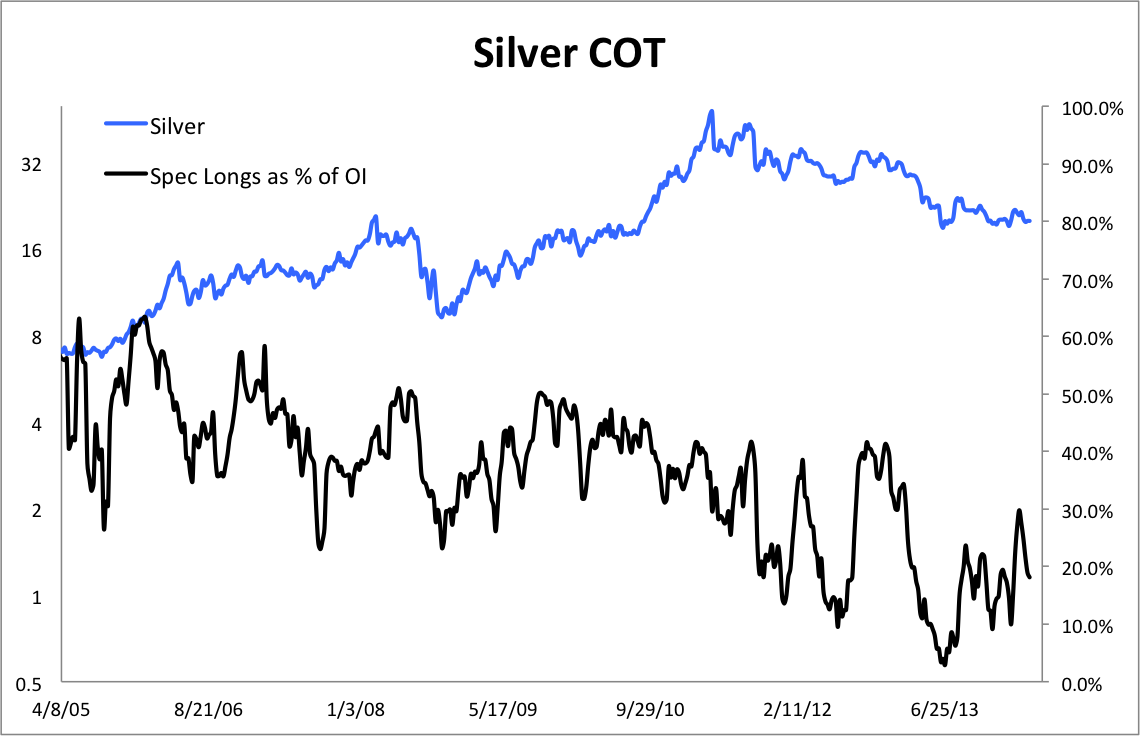
First, here is the general COT. The black is the net speculative position (long) as a percentage of open interest. It has declined materially over the past few weeks.
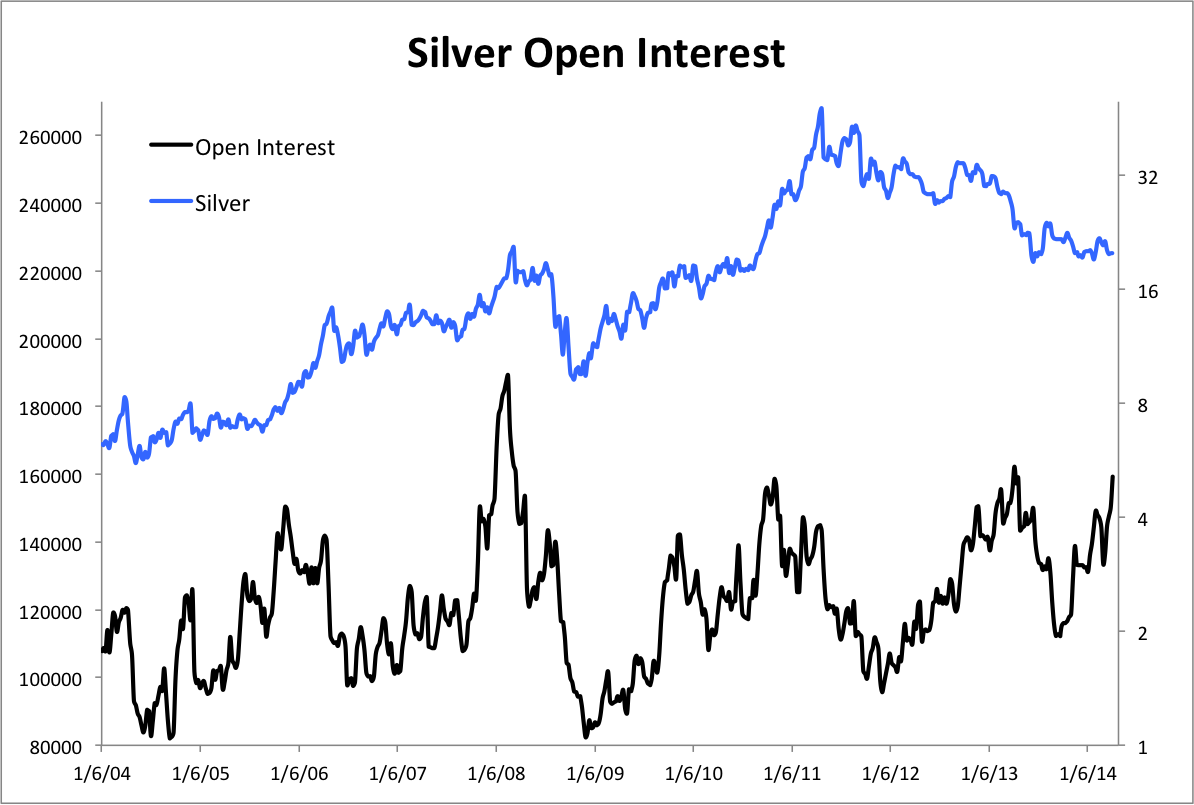
Next is open interest. Interestingly, unlike Gold whose open interest is at 5-year lows, Silver’s open interest is robust.
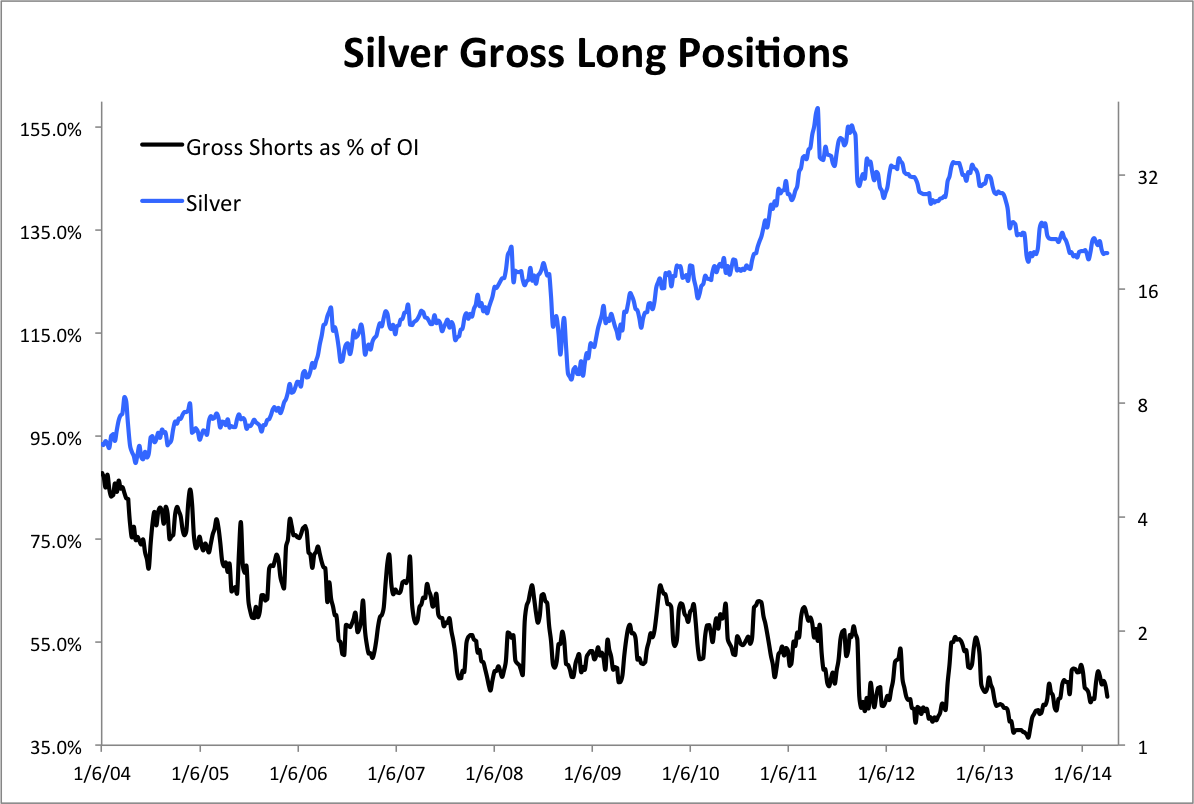
Here is the speculative gross long position as a percentage of open interest. (There is an error in the legend). Note how speculative longs have steadily declined throughout this bull market.
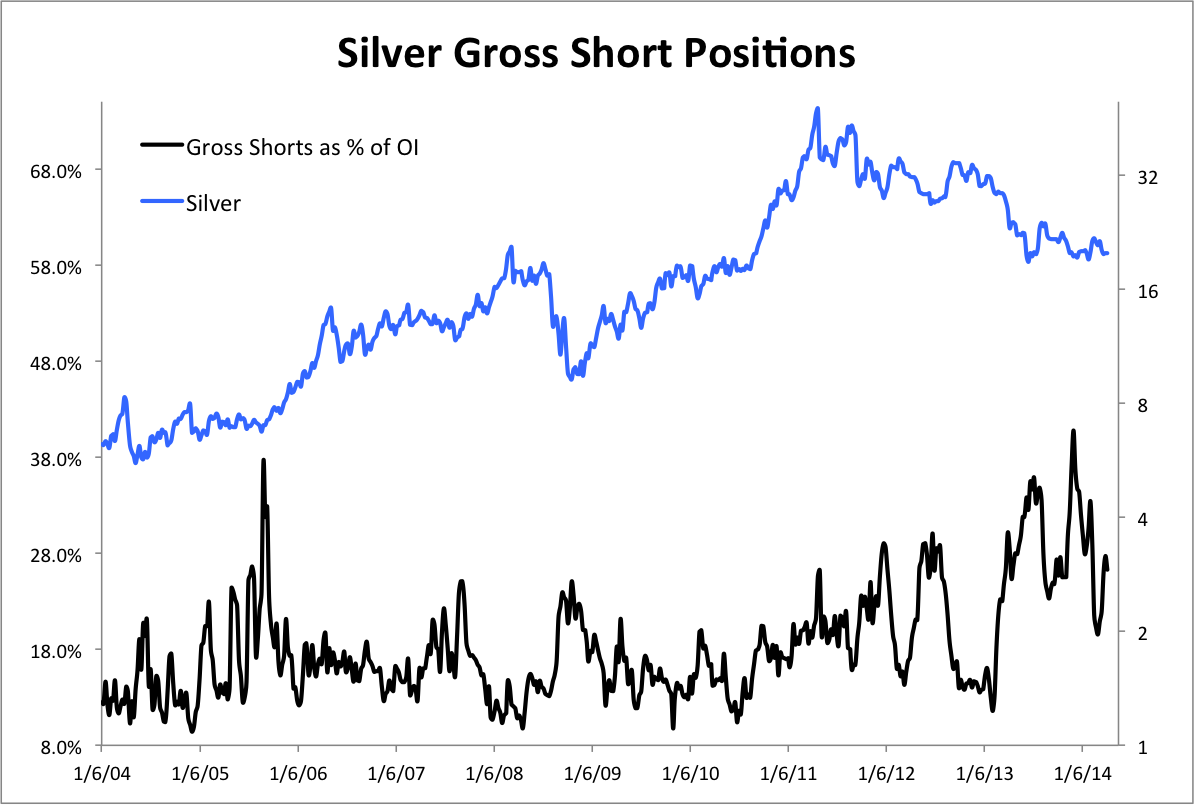
Here is the gross short position. Note how it was extremely elevated at the end of 2013.
This is a sample of some of the things we look at in our premium service.


