Bull Flag’n in Gold and Silver?
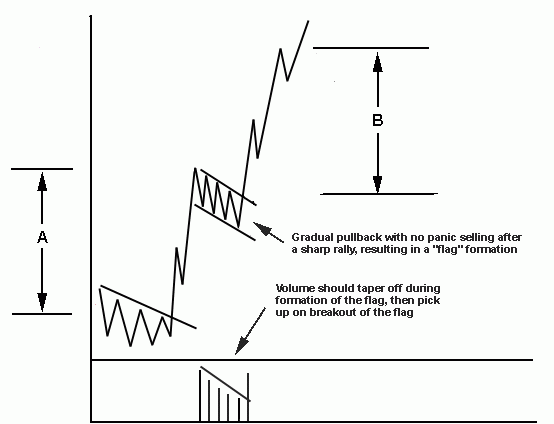
When a market makes a strong vertical type move coming out of a consolidation or correction, odds are a bull flag might follow. A bull flag is essentially a small rectangle or triangle-like consolidation that seperates two very strong moves that tend to be equal in terms of size and duration. Note the chart below:
It is important to note that bull flags occur in the middle of a very large move. In other words, you don’t see this pattern after a market has been rising for quite a while. It develops after a strong rise that follows a correction or consolidation.
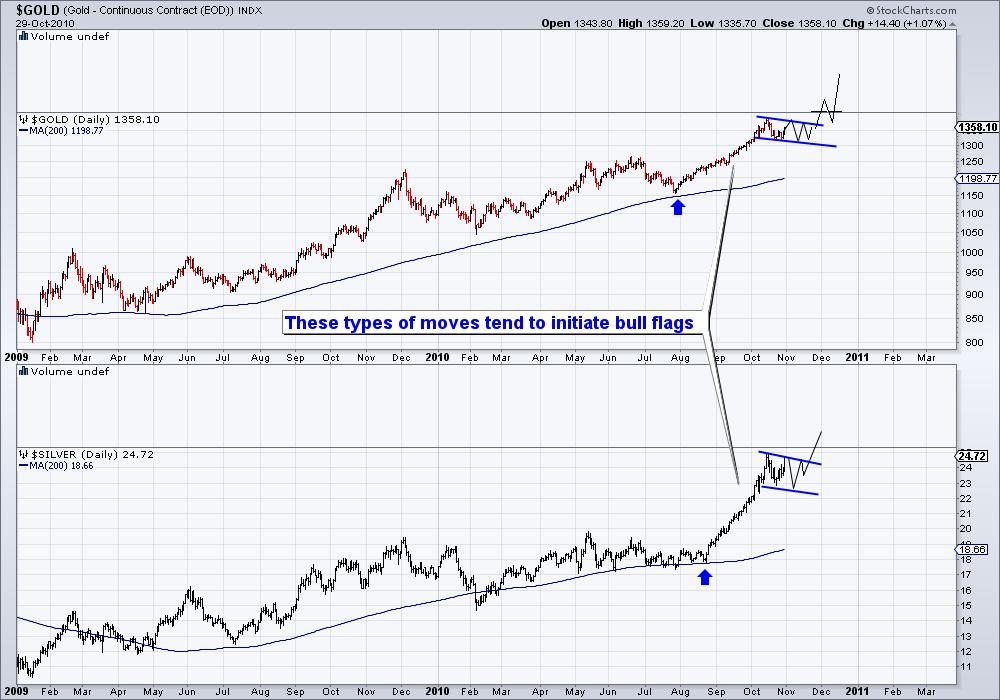
Take a look at the chart below (Gold at top, Silver below).
Note that Silver had consolidated from December 2009 until late August, while in the same time frame Gold essentially couldn’t sustain the marginal new highs made in the late spring. The metals were in a consolidation and the breakout was essentially a vertical move.
It will take another week or two to give us a better idea of this corrective pattern. If the metals continue to hold above their lows than the odds of a bull flag pattern increase.
Good Luck!


