A look at Gold and Silver Sentiment
Disaster in precious metals land has been averted (for now) as the market unwinds what appears to be sudden excessive bearish sentiment. Surveys such as the daily sentiment index reached single digit levels for Gold and Silver (the previous week) while the net speculative position in Gold and Silver has declined dramatically in recent weeks. This is encouraging for precious metals bulls as it portends to a rally but negative sentiment by itself cannot change the broader trend.
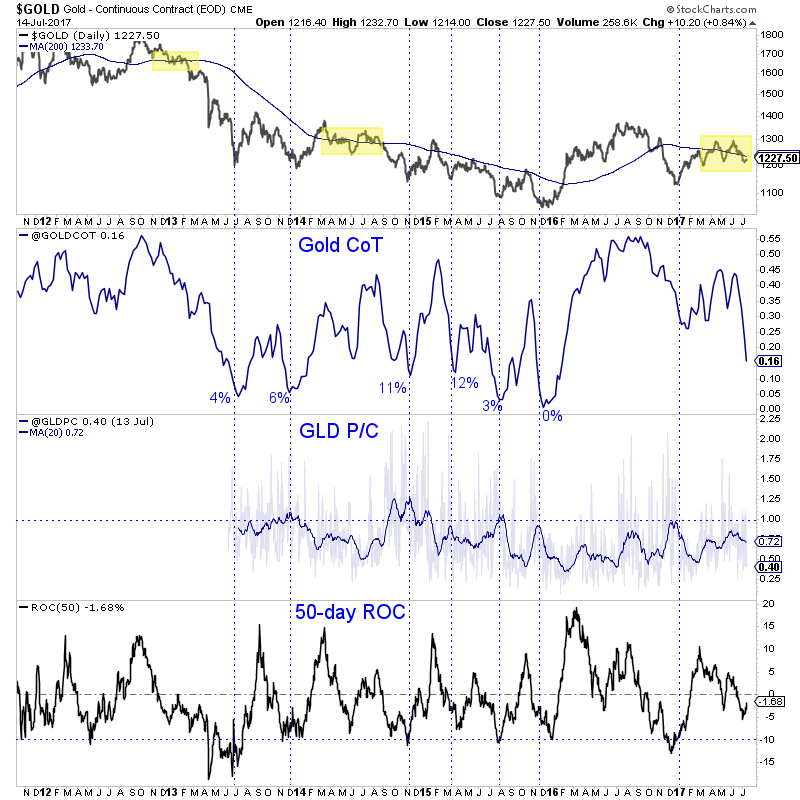
In the chart below we plot Gold with its 200-day moving average along with Gold’s net speculative position (as a percentage of open interest), the GLD put-call ratio and Gold’s rolling 50-day rate of change. The vertical lines mark Gold at its most oversold points based on the three indicators.
Gold’s best rallies have occurred with the CoT (net speculative position) at 0% to 4%, the put-call ratio 20-day moving average near 1.00 and the 50-day ROC at -10%. Gold rallied strongly in November 2014 with the CoT at 11% but note the put-call ratio was at its highest on the chart. While the current CoT is at 16% and at its lowest level in 16 months the other indicators did not reach extremes. In terms of Gold’s price action and the three indicators, the comparison to summer 2014 makes the most sense.
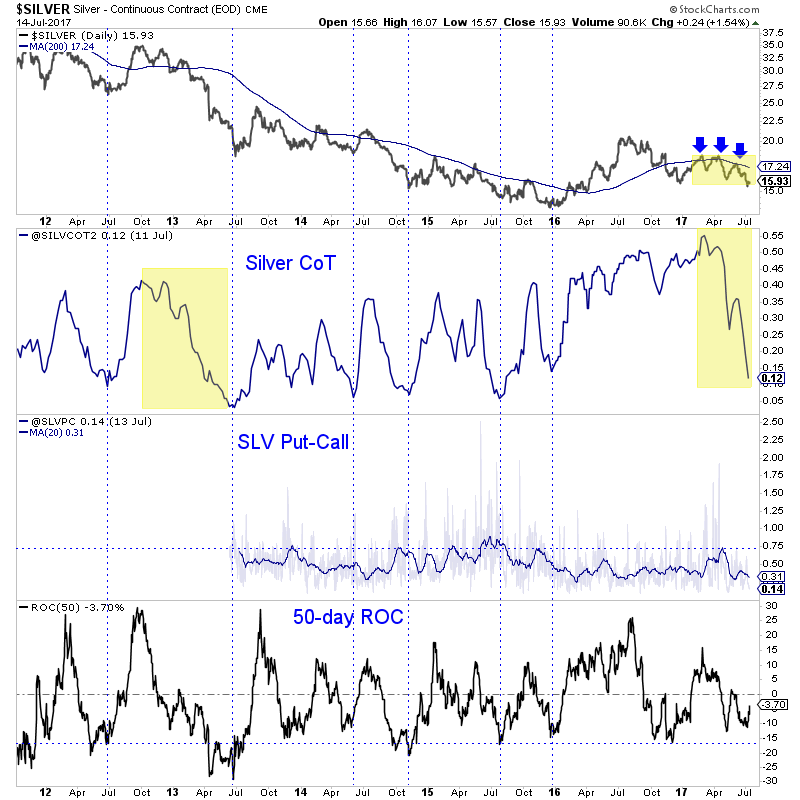
Moving to Silver, we plot the same data and what stands out is the massive liquidation in the net speculative position. In just the past several months it has decreased from 55% of open interest to now 12% of open interest.
The recent price action and massive liquidation is best compared to early 2013. Then, Silver formed three declining peaks and the net speculative position plunged. In fact, in early April 2013, Silver was trading at $27 with a net speculative position of roughly 11% of open interest. Within the next three months Silver plunged to $18, despite the previous massive liquidation in the net speculative position. So the speculators were actually correct.
I do not expect Silver to plunge the way it did in early 2013. It’s far too oversold on a very long-term basis. That being said, the recent price action should not be taken lightly. Silver failed three times at its 200-day moving average, which began to slope lower after the second failure. The rapid decrease in speculation is a good thing but it may only be good temporarily as the broader trend is clearly bearish.
There are a few takeaways here. First, sentiment suddenly became too bearish on Gold and Silver. That will take a little time to correct itself. Considering the entire data, we don’t believe this unwind will last more than a month.
Second and most important, sentiment indicators have to be viewed in the context of the market trend. My view is Gold and Silver are in primary downtrends and therefore bearish sentiment could reach the extremes seen in 2013-2015 rather than 2016. If I am wrong, we will see Gold and Silver explode higher and sentiment indicators follow suit. It is best to analyze sentiment within the context of price action rather than as a leading indicator by itself. For professional guidance in navigating this sector, consider learning more about our premium service and our favorite juniors we plan to buy when the sector becomes extremely oversold again.
Jordan Roy-Byrne CMT, MFTA


