Bird’s Eye View of the Gold Stocks
Since last summer, investing in the mining sector has been akin to riding a mini roller coaster. There have been two huge rallies, two sudden and sharp declines while more than a handful of individual stocks have rebounded over 200% from their lows. Nevertheless, as we noted a few weeks ago the weakness of the metals won out and are dictating the terms. Since we covered the metals in our last missive we wanted to focus solely on the miners. A look at the bear market analog chart as well as a very long-term chart of GDM illustrates the coming risks and opportunities.
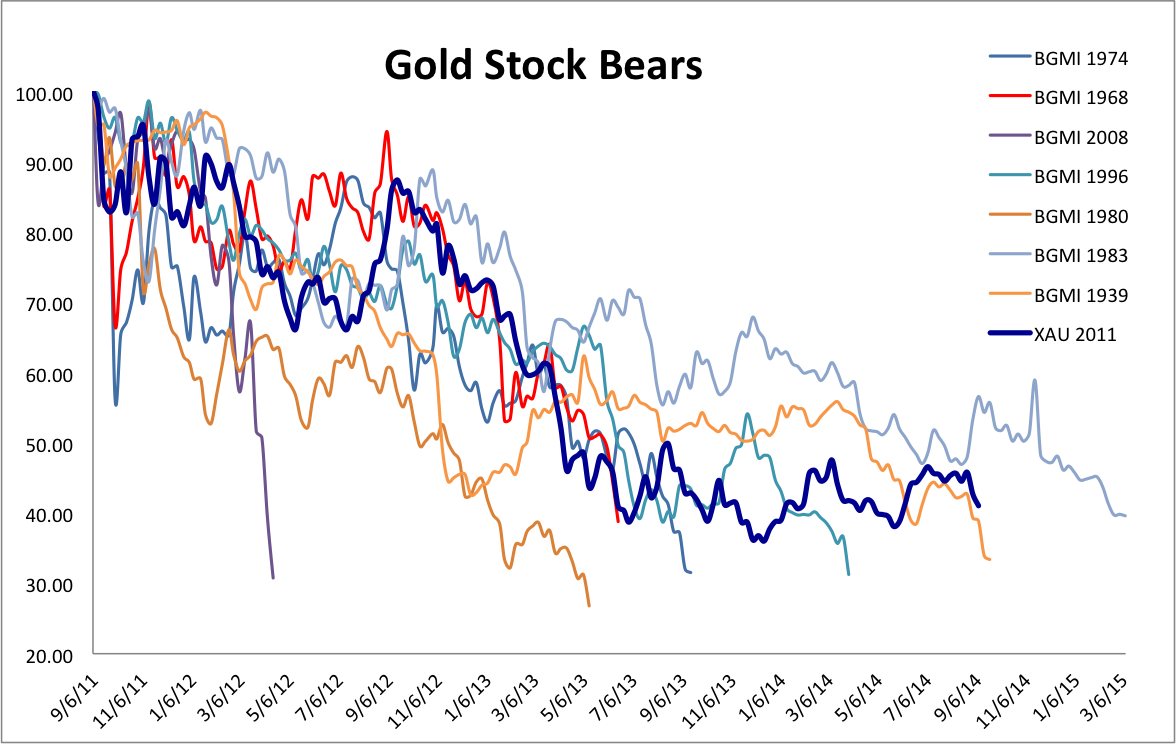
Here is the updated bear analog chart for the gold stocks. The XAU is used for the current bear market. This chart helped identify the opportunity at the June 2013 and December 2013 lows. There has been only one bear market worse than 70%. If you believe the gold stocks have not bottomed then this is the second worst bear in terms of time. The chart argues that if the December low is taken out, it would be so only marginally. A 65% loss at the December 2013 low could become 67% or 68% but probably not anything worse.
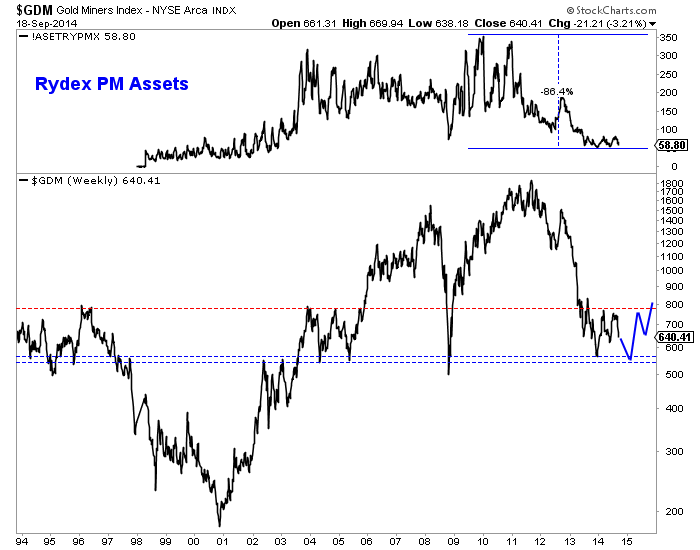
Below is a weekly line chart of GDM, the NYSE Gold Miners index and the basis for GDX. This is one of the broadest indices for miners. GDM has two levels of strong support which date back 20 years. GDM would have to decline 13% and 17% to test those supports. At the top, we plot the assets in the Rydex Precious Metals Fund which have dwindled 86%. We plot in blue a rough projection only for consideration purposes.
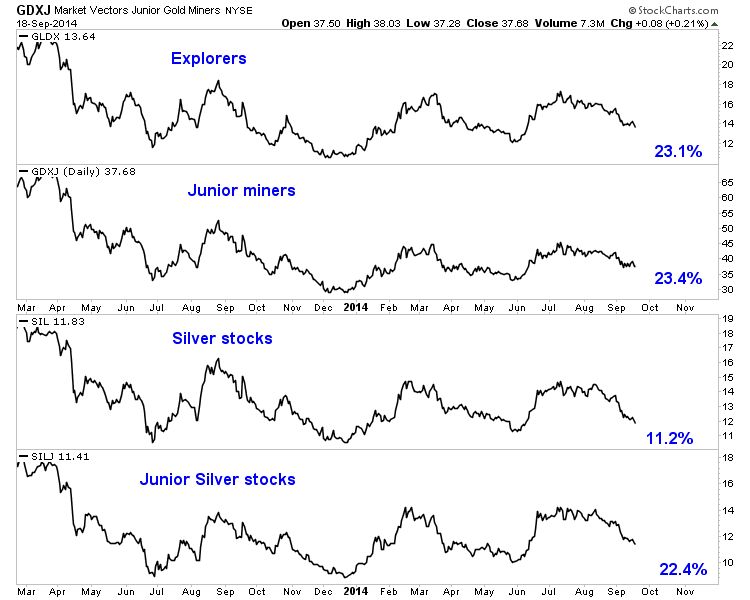
In looking at long-term charts of miners, I find that a double bottom (seen above) is definitely possible. In the chart below we plot GLDX, GDXJ, SIL and SILJ. Considering a 3% margin of error, three of the four ETFs would have to decline more than 25% to rule out a long-term double bottom.
The risk is quite clear. Failed moves produce fast moves. The miners failed to breakout and have tumbled. The late May lows mark the next support but these points do not amount to much beyond the daily charts. Furthermore, after $1200 Gold’s next strong support isn’t until $1080, the 50% retracement of the entire bull market. Hence, there is a growing risk of the miners falling to their December lows. Therein lies the opportunity. Only time will tell but that point could immediately mark a shift from risk to amazing opportunity. We invite you to learn more about our premium service in which we will soon publish a report on our top 5 buys at the bear market bottom.
Good Luck!
Jordan Roy-Byrne, CMT