Video Update

Posted on

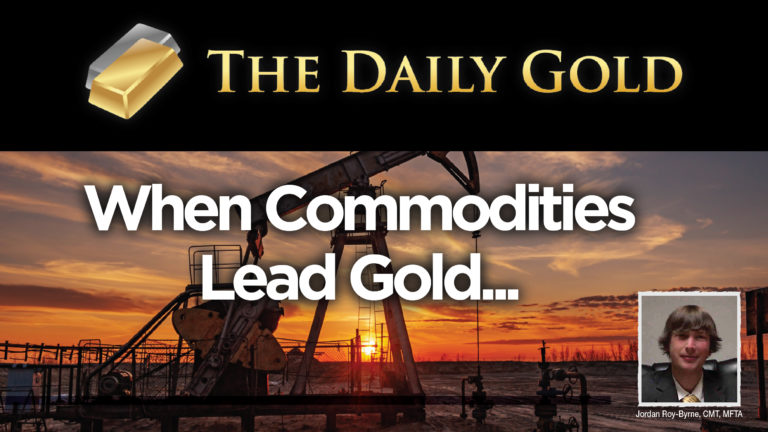
Video: Mid-Cycle Catalyst for Gold

There are two historical examples of sticky commodity prices and rising Oil prices leading to end of long corrections in Gold and the next leg higher. Be aware of this potential catalyst if commodity prices remain sticky into 2022. Click Here to Learn About TheDailyGold Premium

Posted on

Video: Gold & Silver Correction Resumes, No Breakout This Year

We had hopes the sector could consolidate bullishly but that scenario is out the window. Gold should test $1675 and its cup and handle pattern needs more time. Silver has held up well, which is a good sign. It could test $22 and still be in a bullish consolidation. The gold stocks are showing similarities … Continue reading

Posted on

Video: Gold is the Macro Leader

With respect to hard assets, Gold (and Silver) lead the other commodities. Precious Metals have led the dollar in recent years as the other commodities have been more correlated with dollar weakness. Click Here to Learn About TheDailyGold Premium

Posted on

Video: Inflation Hits Temporary Peak

Inflation has peaked for the time being. In this video we analyze the potential implications over the next few months. Click Here to Learn More About TheDailyGold Premium

Posted on

Video: A Bit More Upside Before Resistance

Gold and gold stocks have a bit more upside before reaching resistance, which could lead to a pause or correction. Silver hasn’t been able to pierce $28.50 yet. The recent rebound confirms gold stocks successfully retested the 2020 breakouts and can resume their uptrends. Gold stocks are very close to breaking out against Gold and … Continue reading

Posted on

Video: Gold Stocks Will Outperform Gold Massively

GDX and GDXJ are inching closer to a potential 8 or 9-year breakout against Gold. They are going to outperform Gold on a scale we have not seen since the early 2000s. Click Here to Learn More About TheDailyGold Premium

Posted on

Video: Whats Coming for Gold & Silver

The rebound in Gold has exceeded our target. It could have a bit more upside before testing weekly and monthly resistance. Watch Silver as a leading indicator to see if it can break $28.50 on a weekly and monthly basis. Gold & gold stocks are showing increasing relative strength against stocks and bonds. My base … Continue reading

Posted on

Video: This Gold Chart Shows a Repeat of 1970s

The Gold to S&P 500 ratio chart and gold stocks to S&P 500 chart shows a bottoming pattern in the 1960s, which appears very similar to today. These ratios are in a big, long-term bottoming pattern and they could be emerging from a significant low from a few weeks ago. Click Here to Learn About … Continue reading

Posted on

Video: How Bitcoin Could Hold the Key to Gold’s Next Move

Bitcoin and crypto are extremely overbought and at risk of a significant correction. There are parallels to the end of 2017 peak in crypto which was followed by two corrections in the stock market and a significant low in Gold. Click Here to Learn About TheDailyGold Premium

  • As seen on: