US equities remain the only risk asset trending towards new bull market highs in 2012. All major equities, currencies and industrial commodities do not look as good. Emerging Markets continue to under-perform the Developed Markets and European currencies continue to under-perform Commodity & Asian currencies. Copper, just like all other industrial metals, seems to be struggling the most out of all commodities. All in all, from an objective chart outlook, there are no signs that a major risk off trend has ended, apart from the current safe haven status US equities maintain.
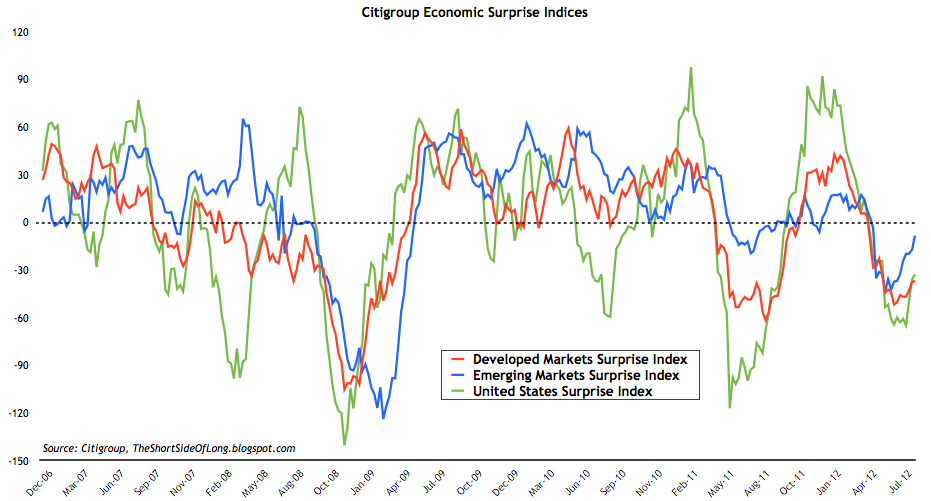
Global economic data continues to beat economists expectations, with a stand out improvement occurring in Emerging Economies. This is a positive for the time being. On the other hand data coming out of Europe is signalling that the recession is intensifying further.
According to the OECD LEIs Eurozone and China are trending deeper into slowdown territory, while United States remains in growth for now. Conference Broad’s LEI’s are looking troublesome too, with the worst readings coming out of South Korea and Japan (both down over 1% on the month). Remember that these two export powerhouses relay heavily on China as its main customer.
ECRI Weekly Leading Index has not changed much in recent weeks. It still remains well below the 2 Yr MA as well in a so called downtrend of lower highs. There is currently a strong divergence in place between this economic leading indicator (Main Street) and the stock market itself (Wall Street). Previous divergences between the economy and stocks over the last decade have always resulted toward the downside.
Featured Article
It has been awhile since I’ve checked the beat of the overall market sentiment, which includes outlook towards currencies, commodities and credit. So let me put forward some recent key points regarding what I see as the prevailing mood in the overall market environment today. A lot of market pundits continue to argue that due to the ongoing negative news, the prevailing mood within the risk asset environment is predominantly bearish. To a certain degree, there is evidence to support this, but in my opinion it is not as clear cut as that. Basically this view comes from the fact that many follow
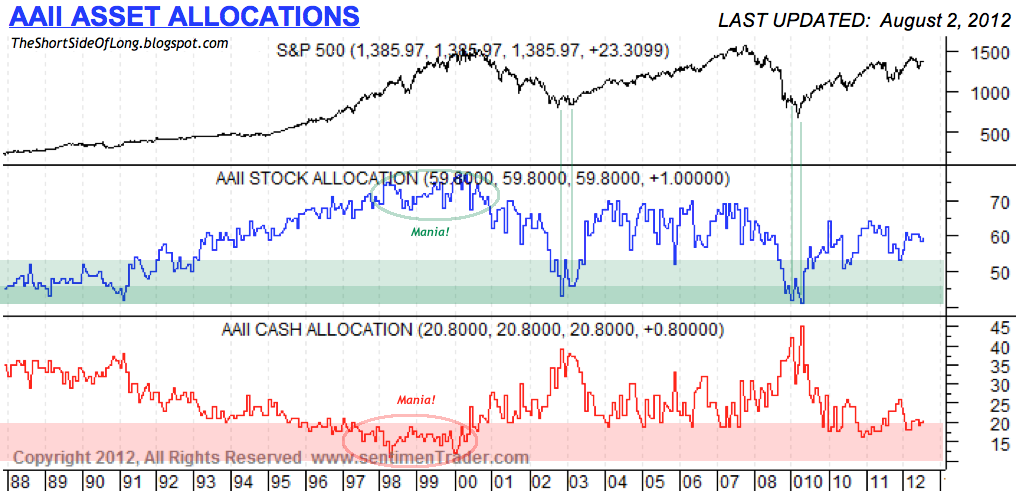
sentiment surveys like AAII, which show pessimism at high levels.

One of the first charts I would like to put forward is the AAII Allocation Survey. As we can see, while retail investors “say” that they are bearish, they are “acting”in quite a bullish manner. Consider the fact that equity exposure to a normal portfolio is at a decently high 60%, while cash exposure is a very low 21%. If we do not count the mania years of the late 90s, when mum and dads were euphoric over equities, we can see that there is definitely optimism towards the stock market and exposure to match. If a correction was to strike us as of tomorrow, cash levels could swell up to 25% and over quite easily; and if a bear market would occur over the coming quarters, cash levels could jump higher than 35%, before a pessimistic signal points to a major buying opportunity.
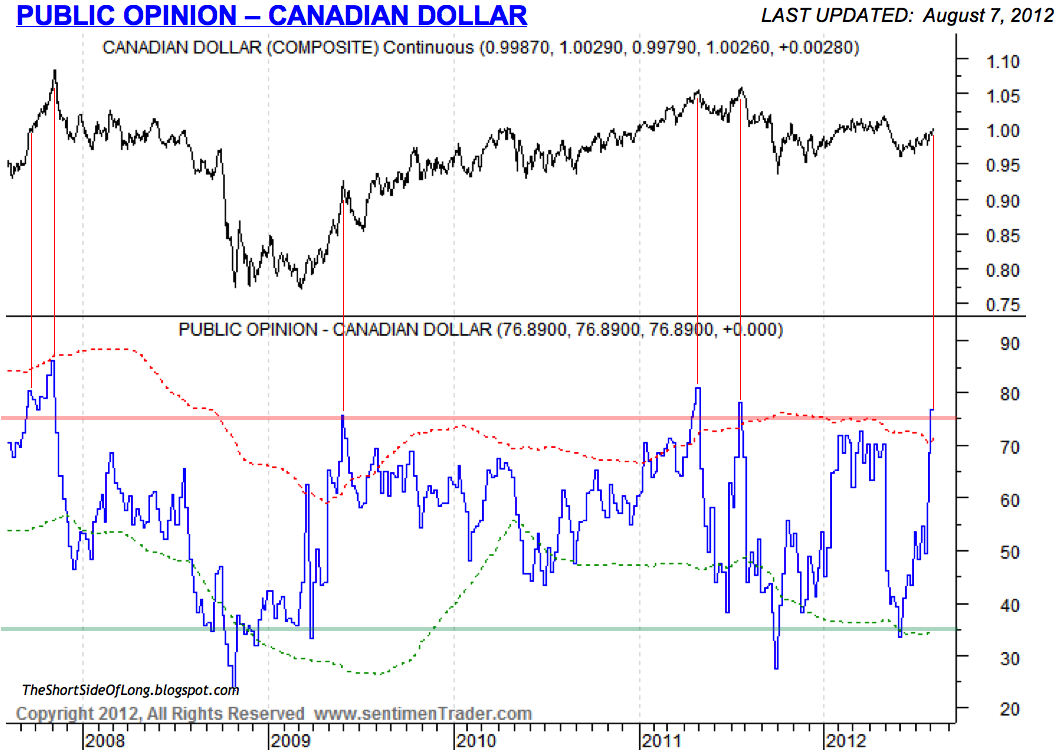
Sentiment reflecting exposure to commodity currencies like the Canadian Dollar has now moved to extreme bullish levels only seen a handful of times over the last half decade. As we can see in the chart above, readings above 75% and towards 80% have topped the Canadian Dollar from intermediate perspective perfectly every time. The reason I bring this up is because currencies like the Canadian Dollar, Aussie Dollar, New Zealand Dollar and others, have been screaming higher in recent weeks and the obvious catalyst is “hope” from
Palvov’s dogs that the Fed will do more QE. Hope is not the best strategy in this game, to say the least.
Since we all know risk assets globally have high corrections, I investigated this concept further. First of all, we should all know by now that the
S&P 500 correlates highly with risk assets and the Loonie is no exception with a correlation coefficient over 20, 50 100 and 200 days averaging 88%. Therefore, what I did in the chart above, was to overlap the Canadian Dollar sentiment with the S&P 500. Interestingly, the results are worth discussing.
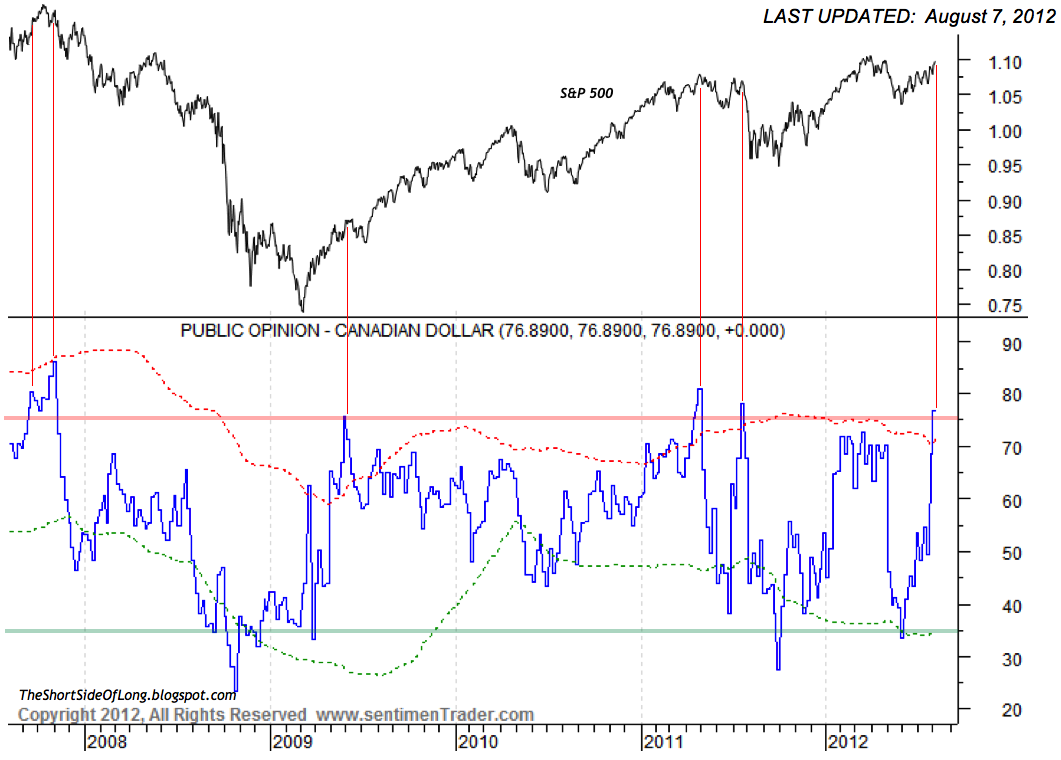
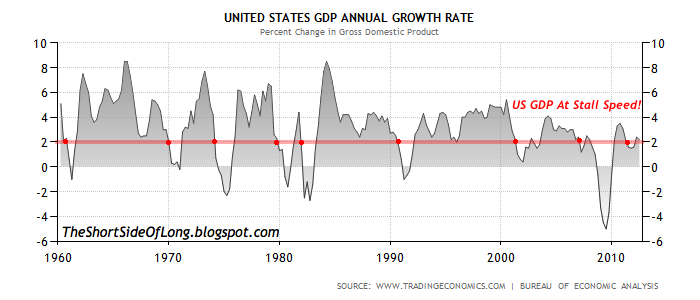
Bullish sentiment readings this high in the Canadian Dollar have been powerful signals of major tops for US equities in both 2007 and 2011. The only other time sentiment was this high but failed to call a prior top was during mid 2009, but even then stocks experienced a multi-month correction. Now, let us not just focus on indicators without paying attention to current conditions. The backdrop in middle of 2009 was one of a recovering economy from the worst recession since WW2, a recovering stock market post 55% decline with a VIX as high as 80 and most importantly the beginning of a new business cycle with earnings completely destroyed. Today, the backdrop is completely different with the economy expanding at stall speed for the last 5 out of 6 quarters, global PMIs are contracting and equities like the S&P 500 have more than doubled since the March 09 lows (Nasdaq 100 is up 180% in three years). And let us not forget that today, the VIX is at 15.

Inflows into junk bond mutual funds are now on track to reach a new record high this year. Bloomberg reported an even bigger figure last night, stating that inflows in Junk mutual funds have now reached $43 billion, which is a record high, with $9.3 billion alone coming in during July 2012. Last time inflows were this strong was in March 2012, just as equities were peaking. If that is not a sign of strong risk appetite and chase for return, then it should be stated that many junk ETFs are trading at high premiums to NAV, with ETFs like HYG showing
a record amount of shares outstanding. If I could borrow a phrase from another smart blogger, this is a sign of an “overheating” market.
Furthermore, subprime loans are back in favour again, with auto-loan credit selling $10 billion of junk debt through to July 2012, the fastest pace of subprime sales since 2007. At the meantime, the current backdrop is one of the
most quietest period of defaults (or should I say no defaults) in Junk Bond market history. The default rate for junk grade quality all the way to triple Cs is extremely low and in some cases at record lows. Financing conditions tend to be the strongest at the end of the business cycle, with excesses and over-leveraging peaks.
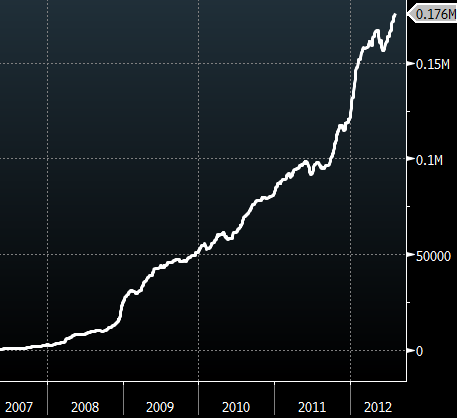
I was reading the Bloomberg website on the weekend and what I found interesting was an article recording exposure to the overall commodity asset class. Bloomberg reported that hedge funds increased weekly exposure on commodities in the longest streak since 2006:
“Hedge funds raised their net-long positions across 18 U.S. futures and options by 4.9 percent to 1.22 million contracts in the week to July 31, the highest since Sept. 6, U.S. Commodity Futures Trading Commission data show. Bets more than doubled since reaching this year’s low on June 5, capping the longest increase since the data began in June 2006.
The number of contracts outstanding across the 24 members of the S&P GSCI rose 0.3 percent in July, the first increase since April, according to data compiled by Bloomberg. Inflows to raw-material funds totaled $564 million in the week ended Aug. 1, snapping a five-week streak of outflows, according to EPFR Global, which tracks the funds.”
In my personal chart, which is shown above, I do not track options contracts so the cumulative exposure is just below 1.1 million contracts. According to my data we are now approaching 1 SD above mean, but the three month moving average is closer to neutral. Sentiment is not extreme on either end, but what I’m more concerned about is the fundamental backdrop as Asia slows down further and also the technical picture of the current CC Index bottom. Let me explain:
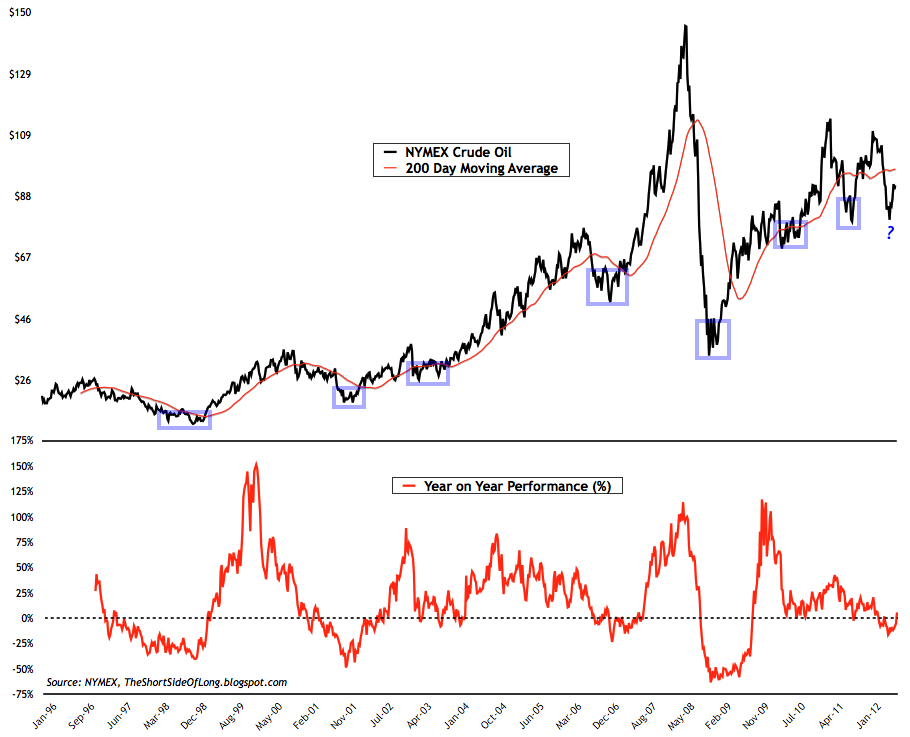
Proper intermediate and long term bottoms within the commodity complex occurred in 1998, 2001, 2003, 2006, 2008 and even 2010. They can be seen in both the
CC Index and
Crude Oil charts. Majority of those bottoms experienced basing patterns, which took several months and some quarters to develop. On average it was between four to five months. What I find disturbing about the current technical picture of the CC Index is the fact that we did not base for more than a couple of weeks and then experienced a major V trough reversal – the weakest of all technical bottoms usually present to just overwork oversold technical conditions. Therefore, while I remain constructive towards the secular bull market in commodities over the longer run, I am currently very discouraged by a weak fundamental and technical picture. I remain cautious in the short to medium term.

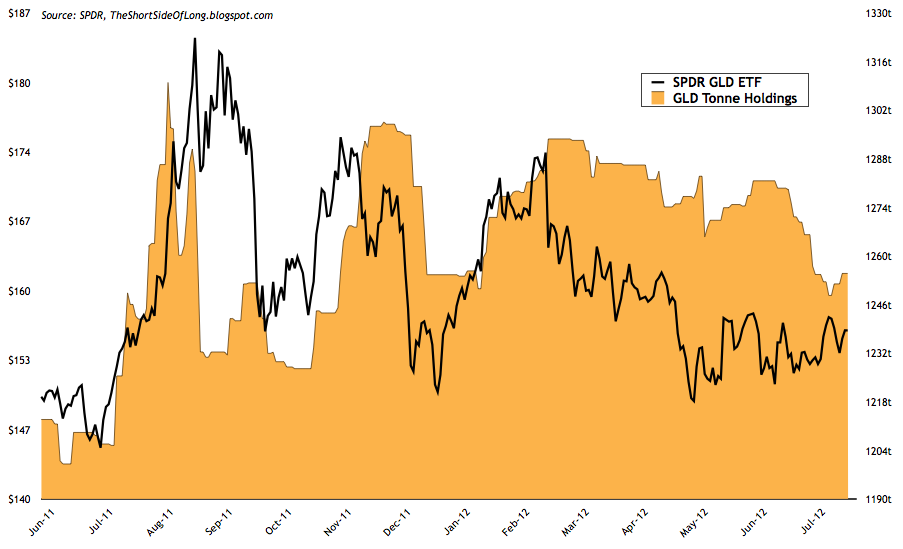
Sentiment in the Precious Metals sector remains depressed. Public Opinion on Gold, Silver and Platinum is still very low and pretty much unchanged from previous weekly charts. GLD physical tonnage holdings, seen above, tends to be a good barometer of retail investor appetite and here too the picture is quite similar. Recent outflows in the month of July have come about as Gold sits around its $1530 support level and its $1640 resistance in a tight range. It seems retail money is scared of a further breakdown in the Gold price, but it is usually smarter to do the opposite just like in September and December 2011.
Trading Diary
- Positioning: Long focus is towards secular commodity bull market, with Precious Metals and Agriculture offering the best value. Substantial position is held especially in Silver, because I believe central banks will continue to print money and devalue currencies whenever global economic activity deteriorates. Precious Metals longs are hedged because Silver could break down below $26 support, but an upside break out will take hedges off. Short focus is towards secular bear equity bear market, with cyclical sectors and credit offering best selling opportunities. Mild to modest exposure is held short in the US High Yielding Junk Bond market, as well as various US stock sectors like Technology, Discretionary and Dow Transportation.
- Watch-list: Commodity currencies like Aussie, Kiwi and Loonie are also on my watch list of potential shorts right now, as negative surprises await as China slows further. With Euro being the most hated currency, a better risk off trade could be selling the British Pound right now. A major short in due time will be US Treasury long bonds, as they are extremely overbought and in a mist of a huge bubble mania.


