Decision Time for Silver
Chart 1: Silver finds itself between a downtrend and a strong support…

Source: Bar Chart (edited by Short Side of Long)
Precious metals sector outperformed majority of other asset classes in Q1 of 2014, however that strength has recently dissipated. Whats even more interesting is the fact that while Gold and various miners rebounded powerfully in quarter one, Silver has continued to disappoint. As we can see in Chart 1, the metal now finds itself at a technical pressure point.
To break on the upside, Silver will have to overcome a downtrend line, which has been in place since the bear market began in May 2011. On the other hand, if Silver was to move towards new bear market lows, it will first have to break a strong support area around $18.50 to $19.00 per ounce. A break in either direction could occur very soon, and would be a leading indicator for the rest of the PM space.
So which way will Silver move?
While I wish I could answer that question with precision, unfortunately I do not know as my crystal ball is currently getting fixed. What I will do is place forward a handful of clues, so that we can work on probabilities and case scenarios.
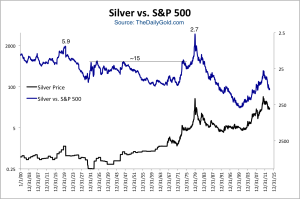
Chart 2: Silver has declined 15% over last 3 months, but not yet oversold

Source: Short Side of Long
Over the last three months, Silver has sold off by about 15%. As we can see from Chart 2 above, Silver is slightly oversold, but not yet past the 1.5 standard deviations on the downside (or about 19% decline) that I like to use. Therefore, more selling could come in the short term, before we consider the long side. Keep in mind that Silver usually follows Gold closely and Gold itself is even less oversold over the last 3 months. Finally, most of other classic technical indicators (RSI, MACD, STO, etc) are not at oversold daily or weekly levels either.
Chart 3: Change in hedge fund positioning is now close to bearish levels

Source: Short Side of Long
Recent COT report, released last Friday, continues to show that hedge funds and other speculators continue to dislike Silver. However, future positioning hasn’t reached extreme bearish levels just yet. Last time we saw those type of conditions, signalling a contrarian buy signal, was around the back part of the panic sell off in middle of 2013. Since there is numerous ways to track the COT report, I thought I’d include a few other interesting charts:
- Disaggregated report shows managed money is quite bearish, but not yet at outright extremes we saw during July 2013 intermediate bottom
- Commitment of traders net long positioning as a percentage of overall open interest is also quite low, but has not yet reached extreme single digit percentage level
- Hedge funds continue to hold large gross short positions on Silver, but if prices were to move lower, there is a possibility that these could yet increase further
Chart 4: Premium during topping phase, discount during basing phase?

Source: Short Side of Long
As precious metals sector was building a complicated top from 2011 into 2012, majority of the closed ETFs (such as Central Fund of Canada) displayed a premium to its net asset value. In other words, retail investors were bullish on Gold and Silver, just prior to a correction. Today, we have a totally opposite picture.
The sector has corrected rather sharply in 2013 and ever since the sell off, retail investor have pushed the CEF ETF into discount territory (refer to Chart 4). While lower prices are still possible, it is almost always wiser to be a buyer when majority are sellers. Therefore, if the ETF traded at a premium near its peak, most likely the current discount is a signal that we are closer to the final bottom.
Chart 5: Sentiment on Silver has been very negative throughout ’13/’14

Source: SentimenTrader (edited by Short Side of Long)
Next up, we look at SentimenTrader’s public opinion levels. As we can see, Silver continues to hold support around $19, while sentiment on the metal is rather negative (only 31% bulls today compared to 91% bulls in May 2011). Public opinion readings this low are a decent indicator of a possible reversal in price, however at times negative sentiment readings can also occur just prior to a final collapse.
Finally, there are many other indicators traders should research prior to making up their minds on the up and coming Silver move. These include Gold sentiment indicators, Gold Miners breadth readings, ETF fund flow data, volatility and put / call ratios, ratio between Silver & Gold, Silver & Silver Miners and Gold & Gold Miners, and so forth. It is very important to do your own research before anticipating the next move.
However, when it comes to speculating on price directions, maybe the most prudent advice I could give is to follow Jesse Livermore, who famously said:
In a narrow market, when prices are not getting anywhere to speak of but move within a narrow range, there is no sense in trying to anticipate what the next big movement is going to be. The thing to do is to watch the market, read the tape to determine the limits of the get nowhere prices, and make up your mind that you will not take an interest until the prices breaks through the limit in either direction.