Global Business Cycle In Charts
Global Business Cycle In Charts
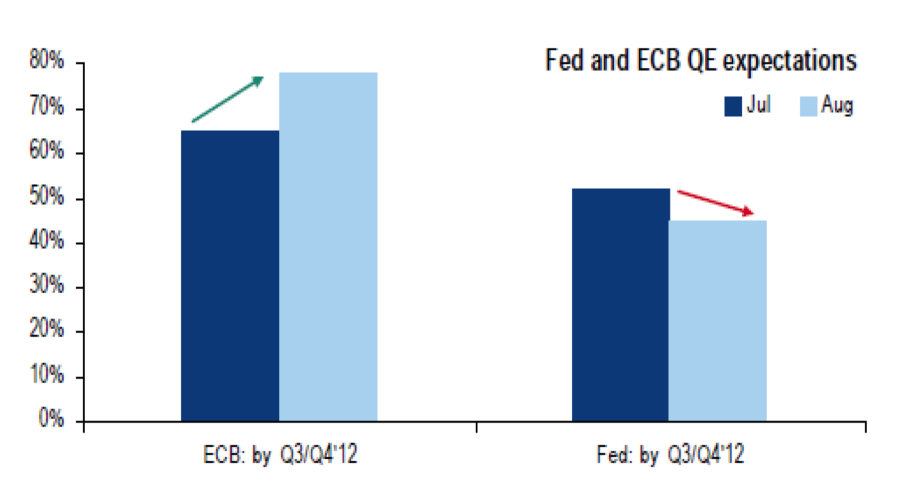
- Recent Merrill Lynch Fund Managers Survey showed that 8 out of 10 fund managers expect ECB to engage into QE by the end of the year, while 5 out of 10 expect Fed to re-start QE. Also to note was that managers increased equity exposure to overweight, increased exposure to commodities from underweight to neutral and finally decreased exposure in both cash and bonds.
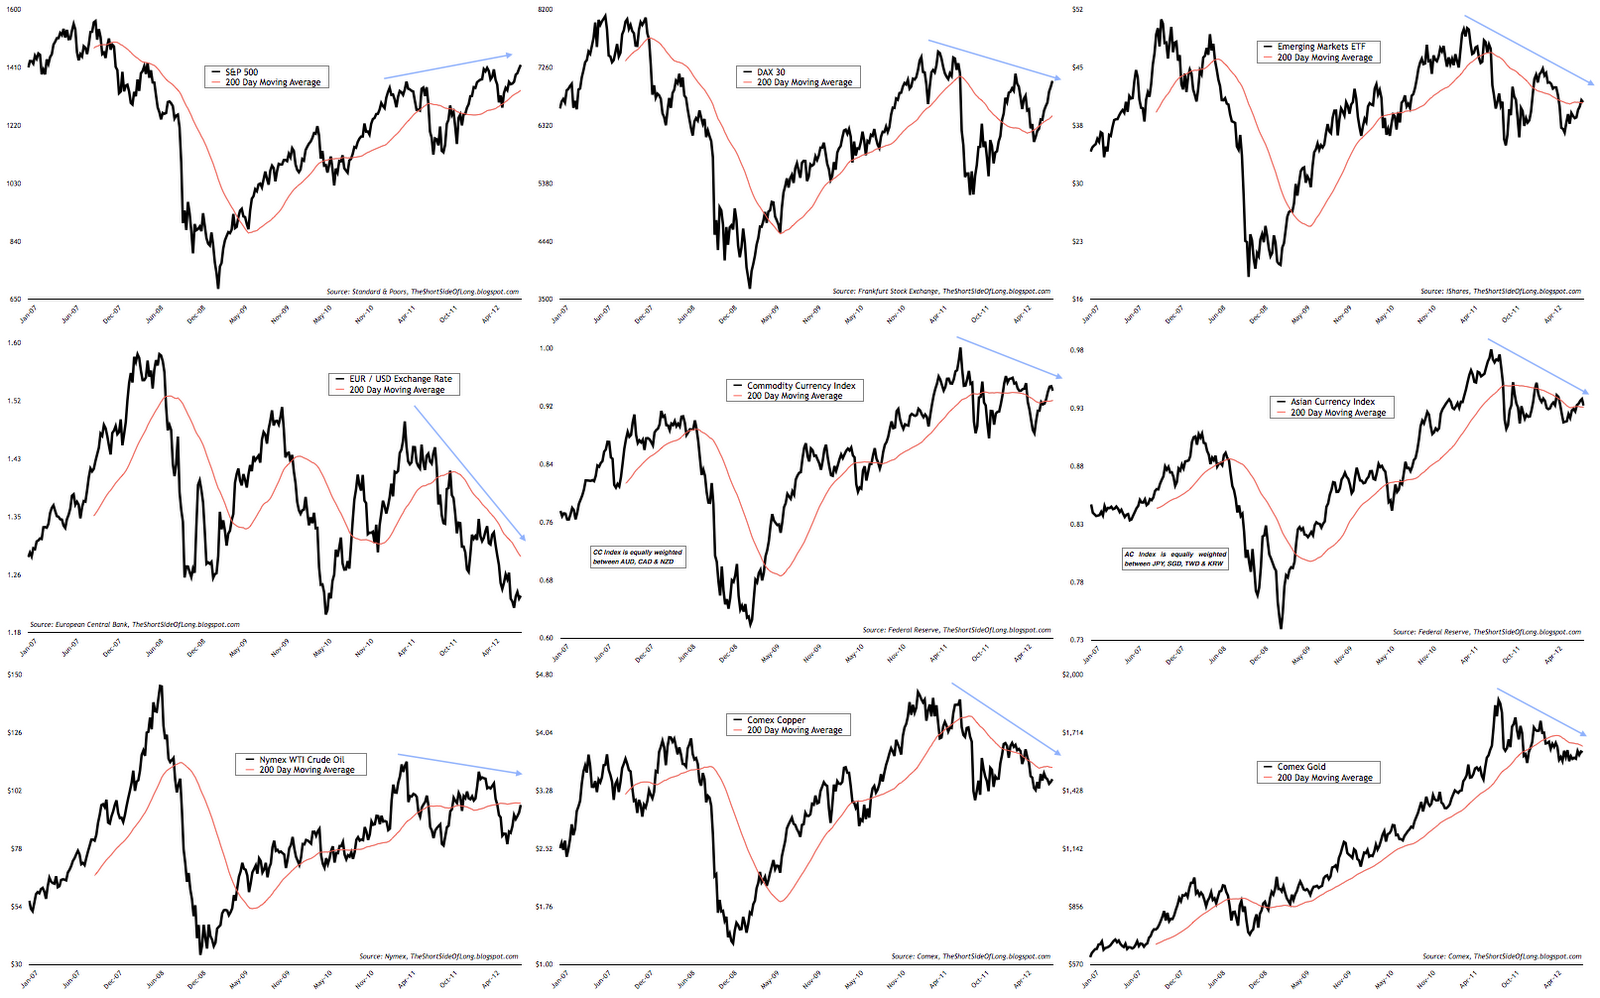
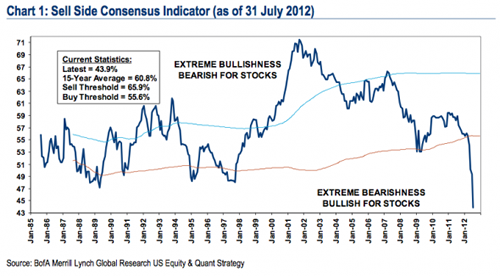
- Bulls well and truly dominate the media space (CNBC, Bloomberg). That is usually what happens when US equities rise for six straight weeks and EU equities rise for 11 straight weeks. NYSE 10 day TRIN breadth measure has now become extremely low and joins other indicators like the VIX in signalling maximum complacency.
- Treasury Inflation Protection securities (TIPs) have done amazingly well in recent years. We have seen a very strong correlation with the overall business cycle since early 2009. TIPs have tracked the improvement in equity prices, industrial production and weekly jobless claims perfectly. Fast forward to today and we see TIPs breaking down. What is the message for other risk assets?
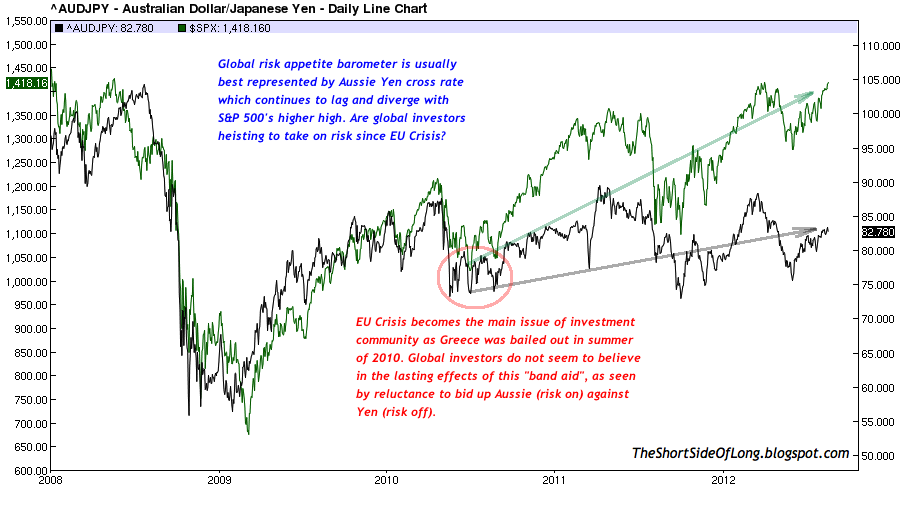
- Global risk appetite is usually best represented by the Aussie Yen exchange rate cross. Australian central bank is seen as a super hawkish inflation fighter during economic upturns, while capital naturally finds its way into Japanese Yen during downturns as a safe haven – a perfect risk on / risk off barometer. Aussie Yen cross continues to send a warning signal for other risk assets.


This is not the only survey confirming this outlook. The highly respected Ifo Business Confidence survey, which tracks the opinions of 3000 CEOs – most of which come from manufacturing powerhouse companies – also shows a similar outlook. The fact of the matter is that the majority of German CEOs think we are currently in the downswing of a business cycle, with a recession approaching.
Away from the Merrill Lynch survey, this weekend I also had the pleasure of conversing face to face or through email and telephone with quite a few global investors, newsletter writers and Australian miners.From what I sensed, while miners were scared of further slowdown, majority of investors (who sit in their offices behind computers all day) thought that things in Europe were just about as bad as they could get. They kept quoting how everyone was very negative on Europe and that from a “contrarian” point of view (their words), the worst is most likely over.


I also tried to explain to my investor / trader acquaintances that private sector business conditions in major European countries were no where near depressed or bottoming. Merely, they were only starting their contraction as outlined by the ZEW Business Conditions in the chart above. While we are down to two and half year lows, we are still in the positive readings.
Than the conversation turned to China (as it always does). The Red Dragon is the mystery beast that no one has figured out yet. What is the real growth rate? Will the property bubble burst? Will we see a soft or a hard landing? Is it a cyclical or structural problem? And the questions went on and on.
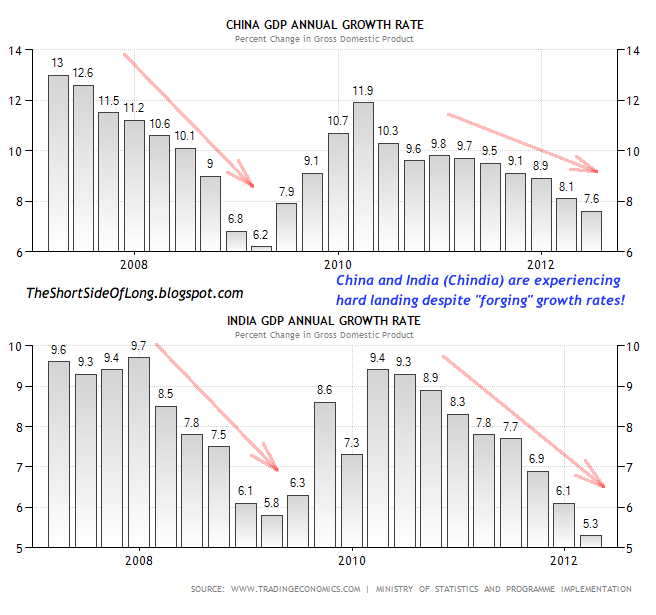
My view is that not only China, but also India, is headed for a very hard landing. First of all, while I haven’t been in business investment for too long (as I am still very young on a relative basis to many professionals), I have to admit that from studying history, I have never seen or heard of any economy “landing softly” from large over-capacities. This is just a myth and I think we will see it again with Chin-dia.
First of all, if major Asian economies are growing anywhere near 5% to 7% like we can see in charts above, I find it astonishing that companies like McDonalds are experiencing falling sales in Asia. Analysts recently reported that:
“Same-restaurant sales rose 3.6 percent in the U.S. and 3.8 percent in Europe in the quarter. Analysts expected gains of 3.5 percent in the U.S. and 2.4 percent for Europe. Comparable sales rose 0.9 percent in the Asia/Pacific, Middle East and Africa region, hurt by weakness in Japan. Analysts expected a 0.8 percent increase in that region.”
Please understand that unlike in US and Europe, Asia is still not saturated with McDonalds restaurants and this has been the strongest region when it came to growth rates over the last few years. So, it is my opinion that I would rather trust McDonald’s revenue report, where sales in Asia are barely growing, than the official government GDP figures.
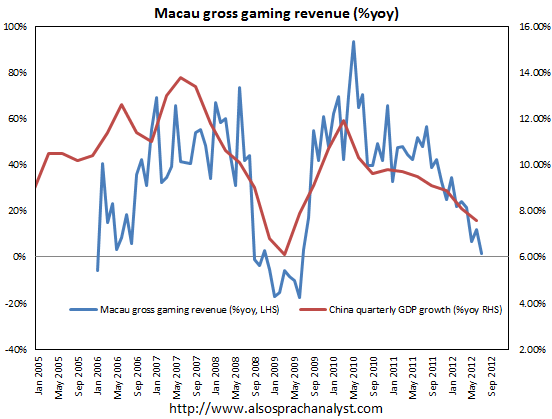
I also find it interesting that the Macau gaming revenues have totally collapsed in recent months, and if this is any indication of where the GDP figures might be in coming quarters, than a hard landing is much more likely than a recovery that many analysts are still predicting.

Many China bulls claim that Growth is really coming from the construction side of things, however month after month all I see is an increasing trend in steel inventories, falling Chinese steel prices, falling Australian coking coal and iron ore prices (necessary to produce steel) and falling global cement prices (down 40% to 50% from their recent peak). Copper continues to act very weak, not confirming the S&P 500 rally, despite further stimulus talk from the ECB and the Fed.
Then we move onto United States. Let be honest, with the rest of the world “looking bad”, the conversation usually turns towards “de-coupling” themes, where investors state that the US is the cleanest dirty shirt, best house in a bad neighbourhood or the tallest midget in a circus.

Personally for me, the US economy and its stock market remain in a secular bear market. That means, any recoveries, no matter how powerful in the cyclical term will eventually disappoint again. As we can see in the chart above, Capacity Utilisation – a lagging economic indicator, shows that the cyclical recovery post the 2008 recession is very similar to the recovery post the 1974 recession, both occurring in the context of a secular bear market. In the coming months and quarters I expect the economy to start to disappoint.

The more important leading indictors, like the Philly Fed Index which once again contracted this month for the fourth time in a row (not seen since 2008), is signalling very very weak growth and most likely the beginning of a recession. The bulls are somehow managing to put a positive spin on the data, just because their minds are clouded by couple of % points rally in the equity market, but the fact is that the three month moving average is seriously contracting.
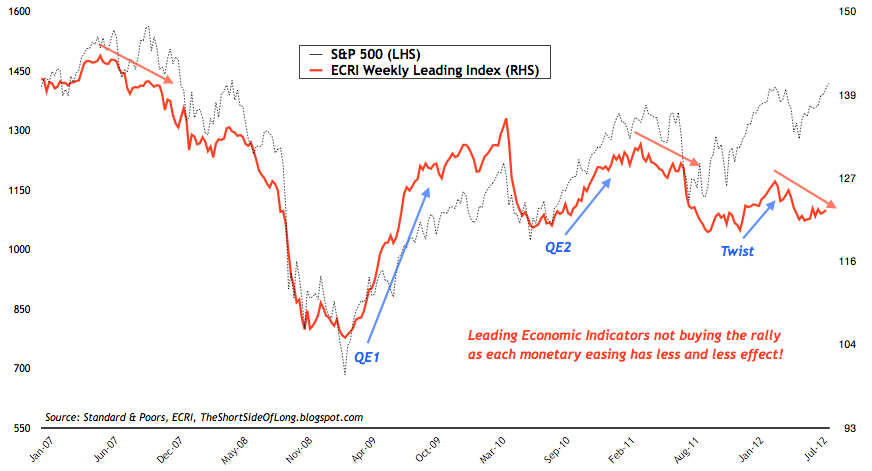
The ECRI Weekly Leading Index is also not buying into the recent equity market rally either. First of all, the divergences between future economic activity represented by the ECRI LEI and stocks represented by Wall Street bidding up stocks in “hope” of stimulus is enormous, as we can see in the chart above. Therefore, either the stock market is right and the economy will miraculously jump start into “turbo speed” or the stock market is wrong and gravity is waiting around the corner.
Second of all, it is plainly obvious that each central bank policy stimulus program from late 2008 onwards is having less and less of an effect. In his recent interview with Tom Keene on Bloomberg, Gary Shilling summarised quantitative easing perfectly:
“Each time unsuccesful policies are tried, they are less effective as investors, consumers and businesses recall previous experinces. The effects of quantative easing have only been temporary.” ~ Gary Shilling
I couldn’t agree more and neither could the ECRI chart above. Printing money cannot prevent another recession or downturn. Sometimes it can only post pone it in the shorter term, however we have been postponing a downturn for two summers in a row now and if we manage to postpone it yet again, not even a ten year old kid will believe the growth rates, as we all know economic activity is being “edited” until the US elections pass.

And finally, let us discuss the invincible US corporate profits, which seem to just go up quarter after quarter. It is interesting to see how the bulls are reacting these days, as they notice a dramatic disappointment in revenues (top line sales) just like the bears do too, but they dismiss it to the side claiming that earnings (bottom line profits) are still doing well. Anyone who has a common Economics 101 understanding knows that revenues falling indicate that it is only a matter of time until earnings also start falling.
Well, bulls claims that since “everyone is bearish” stocks will surprise on the upside regardless of revenues. I’ve heard S&P 500 targets towards 1600s and unto 2000s. In my opinion this is totally ludicrous. The main reason comes from a variety of thinking processes, but specifically the ever so popular chart above is usually a bulls best weapon in convincing other bulls that they are on the right side of the trade. I am pretty sure that you have most likely seen that chart on just about every finance blog out there. What a load of you know what…

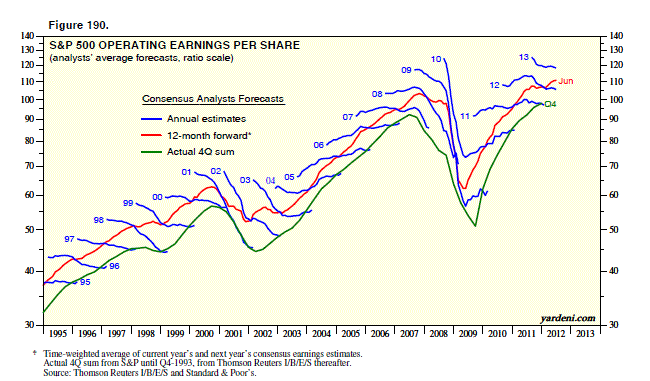
If you really what to know what analysts think, then focus on their earnings expectations. After all, the stock market is valued by its price relative to its earnings. As we can see in the chart above, despite huge signs of a global economic slowdown, analysts are in bullish la-la-land extrapolating ridiculous earnings growth above trend well into early 2014.

And if you do not believe that we are in a ridiculously bullish la-la land, than the chat above (with its readings off the chart… literally) should do a good job proving the unsustainable growth US companies have been achieving for 14 straight quarters now. Since profit margins and earnings tend to mean revert throughout history, the up-and-coming downturn is going to hurt a lot. So what could create an environment where earnings disappoint? I have three main points where earnings could disappoint into 2013 and they are:
- A rising US Dollar is one of the main culprits, as more than 40% of US corporate revenues are derived abroad. As the Dollar rises against global currencies, especially against the BRICs, revenues decrease when they are brought back for reporting. This eventually impacts on earnings.
- As the global economy slows, Europe’s recession intensifies, China moves towards a hard landing and US consumers retrench, demand naturally falls and spending slows down. This eventually impacts on earnings too.
- US corporations have done a magnificent job at stripping down unnecessary costs post the 2008 recession. They have become super lean machines, a result of which has improved their earnings. Having said that, this is not sustainable into the future, and therefore I think it is only a matter of timeuntil corporate profit margins contract.

I am not going to enter into a debate between perma-deflationsts, who have been wrong in picking recessions during the last two slowdowns in the summer of 2010 and 2011; nor perma-inflationsists, who in my opinion are about to be wrong post the US elections, in picking a huge melt up into 2013/14. All I will say is that we are currently in a period of disinflation or deflation. What does that mean? Basically, Economics 101 states that we are now in a period where supply exceeds demand. I will repeat that again… supply exceeds demand. That means prices do not rise, but more likely fall. As we approach deflation on the CPI figures (negative readings similar to 2008), we will see central bankers ready to act with large “money printing” programs in trillions of Dollars / Euros / Yen / Pounds. In the mean time, we will hear a lot of “talk” from central bankers, but we will not see a lot of “walk”.
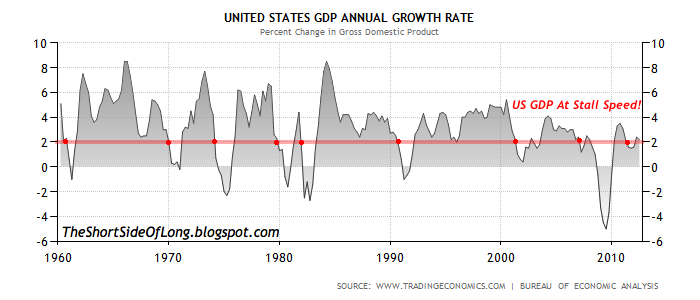
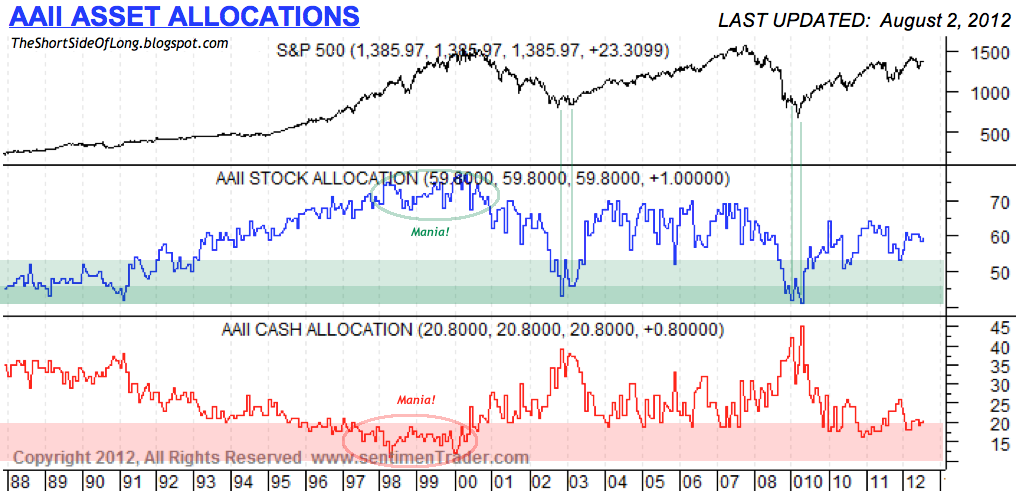
- Outlook: I am of the opinion that the risk asset bear market is upon us and that the global economy continues to slow rapidly into a recession. US GDP has grown 5 out of the last 6 quarters below 2%, which tends to be stall speed. Over the last 60 years, whenever stat like that occurred, we always entered a recession. At the same time corporate earnings and gross profit margins are at record highs, so I expect a mean reversion unlike so many stock analysts. Cash levels with mutual funds, retail investors and money market funds are at extreme lows, financial stress is starting to rise, volatility is at very complacent levels and credit spreads are very narrow relative to fundamentals, so I expect a risk off scenario in due time.
- Positioning: Long focus is towards secular commodity bull market, with Precious Metals and Agriculture offering the best value. Substantial position is held especially in Silver, because I believe central banks will eventually print money again, as the global economic activity deteriorates. Precious Metals longs are hedged because Silver could break down below $26 support, but on upside break hedges will be taken off. Short focus is towards secular equity bear market, with cyclical sectors and credit offering best selling opportunities. Mild to modest exposure is held short in the Junk Bond market, as well as various US stock sectors like Technology, Discretionary and Dow Transportation.
- Watch-list: Commodity currencies like Aussie, Kiwi and Loonie are also on my watch list of potential shorts right now, as negative surprises await with China slowing dangerously. With Euro being the most hated currency, a better risk off trade could be selling the British Pound right now. A major short in due time will be US Treasury long bonds, as they are extremely overbought and in a mist of a huge bubble mania, but first we have to wait for the Eurozone dust to settle.


