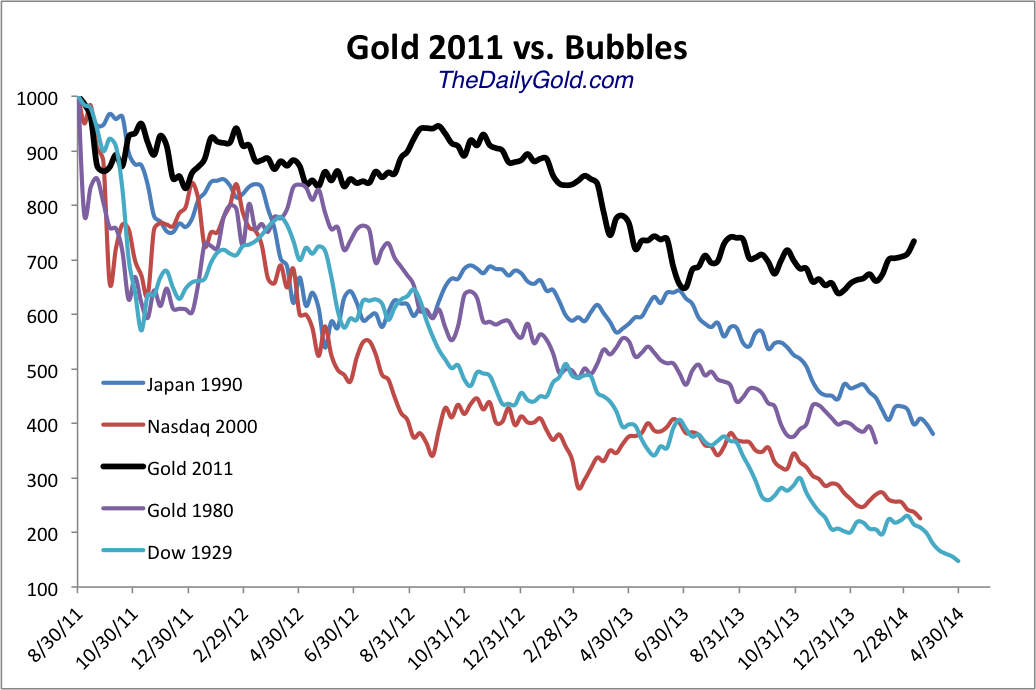
Gold 2011 Peak vs. Past Bubbles
In this chart we compare Gold’s decline from August 2011 with the bursting of the four biggest bubbles of the past 100 years: Nasdaq 2000, Japan 1990, Gold 1980 and Dow 1929.
Those 4 bubbles followed a very similar pattern. They each declined 60% to 85% over a two and a half year period. Each bubble ended at about this time (using the Gold’s top in August 2011 as the starting point). Gold is down 27% while the four bubbles were down a minimum of 62% and an average of about 70%.
If Gold’s peak in 2011 was a bubble then it would be trading at roughly $700 or less.
Gold’s secular bull market is well intact. Click the image to enlarge.