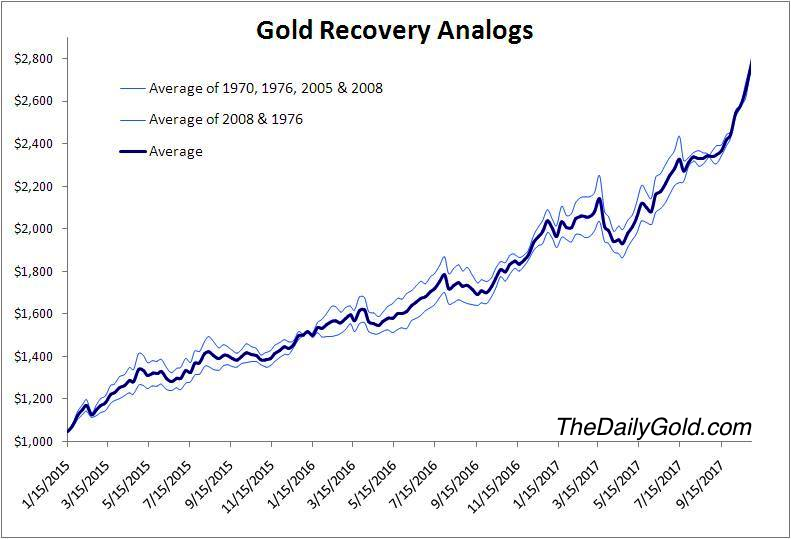
Gold Recovery Analogs
In this chart we have a starting point of $1050/oz on January 15, 2015. This chart uses weekly data so that means Gold could make a daily close or a intraday tick much lower than $1050. Anyway, we use that starting point along with the average recovery of some of Gold’s greatest cyclical bull runs. Even at a starting point of $1050 more than three months from now Gold could rally to $1400 in May (if it follows the average of the 1976 and 2008 recoveries).