Gold Stocks Rolling Over to Early Summer Low
Last week we speculated that a decline in May would create an opportunity. We concluded: The near term prognosis looks cut and dry. Until proven otherwise the short-term trend is down. If that is confirmed in the coming days then let these markets fall to strong support before buying. The Ukraine-induced alleged safe haven bid for Gold could be starting to come out of the market. Regardless of the cause, the charts for the miners (and Gold) continue to urge caution as lower prices are likely ahead before the next major turn.
GDX and GDXJ (shown below) have had a very weak respite since the end of March. Both markets failed twice at their 50-day moving averages. The second failure occurred a few days ago at now declining 50-day moving averages. The markets reversed before even touching the moving averages. The path of least resistance is definitely lower.

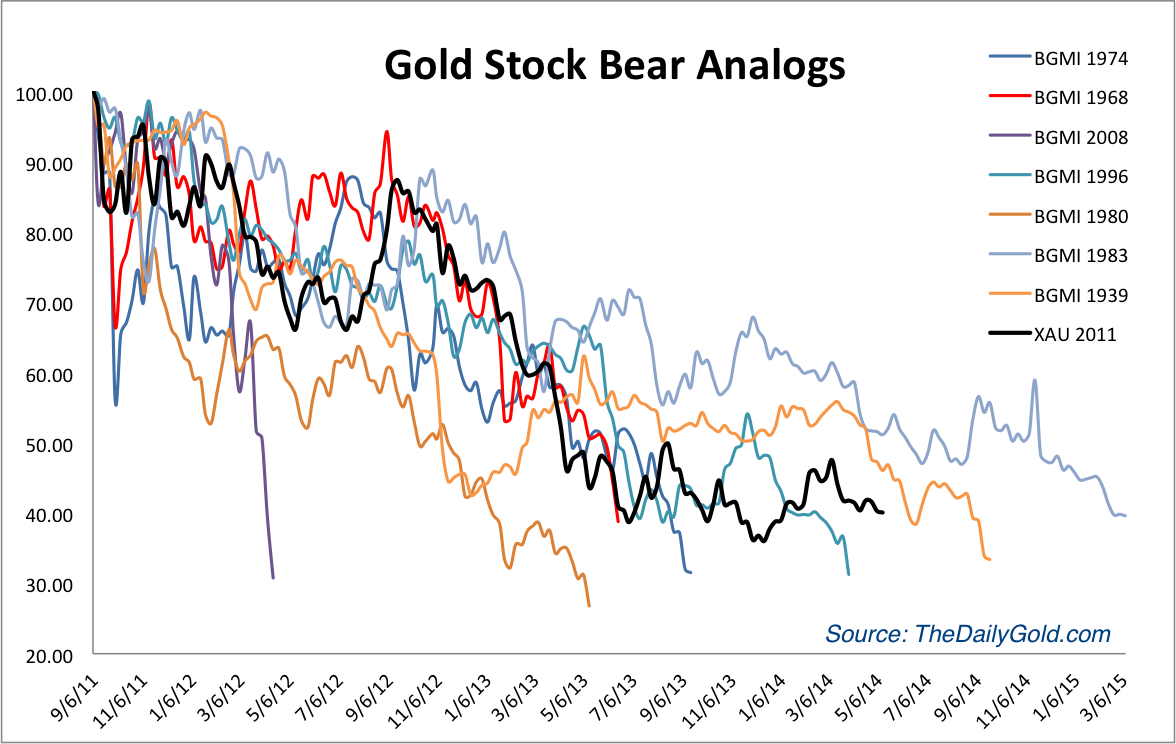
We strongly believe the next low for GDX and GDXJ will occur at or very close to the December 2013 lows and it will be a major low, similar to the June 2013 and December 2013 lows. Its presumptuous to say but not when you take into account the next chart, which many of you have already seen. This chart helped us spot the last two major lows. It may not tell us where the next low will be but it strongly argues that the next low will likely be the final low in this arduous bottoming process which is already in its 11th month.
So how could this next bottom play out? No one knows for sure but we’ll take a stab at it in this next chart and point out a few things. Note how the 200-day bollinger bands were far apart when GDXJ first peaked in 2011, yet tightened before GDXJ began to breakdown. Currently, the 200-day bands are far apart and GDXJ is yet to touch either side. Perhaps GDXJ will touch the lower band next and then a months later touch the upper band. These bands will need to pinch in before GDXJ attempts a major breakout. Volatility continues to be low as demonstrated by the ATR indicator. It is declining and near a multi-year low. Until that reverses, don’t expect any huge breakout in GDXJ.

With respect to our projection, let’s keep in mind that GDXJ rebounded 59% in two months in summer 2013 and recently surged 53% in less than two months (from late December to mid February). Our past historical work shows that the large cap miners usually recover 50% in four to five months after the bottom. Hence, a move for GDXJ from 30 to 50 (more than 50%) in four to five months would be inline with historical tendencies.
One security I am looking at is JNUG the 3x long GDXJ ETF. This is essentially an option on the already volatile GDXJ. JNUG is super volatile but the upside potential is tremendous. During that less than two month period in which GDXJ surged 53%, JNUG returned 210%! I am looking to buy that in the coming weeks when the downside risk becomes very low. I am also looking to buy several juniors I believe have exceedingly strong upside potential over the coming quarters and years. In any event, be patient over the coming weeks and let this final selloff run its course. If you’d like to know which stocks we believe are poised to outperform after this next low, then we invite you to learn more about our service.
Good Luck!
Jordan Roy-Byrne, CMT
Jordan@TheDailyGold.com