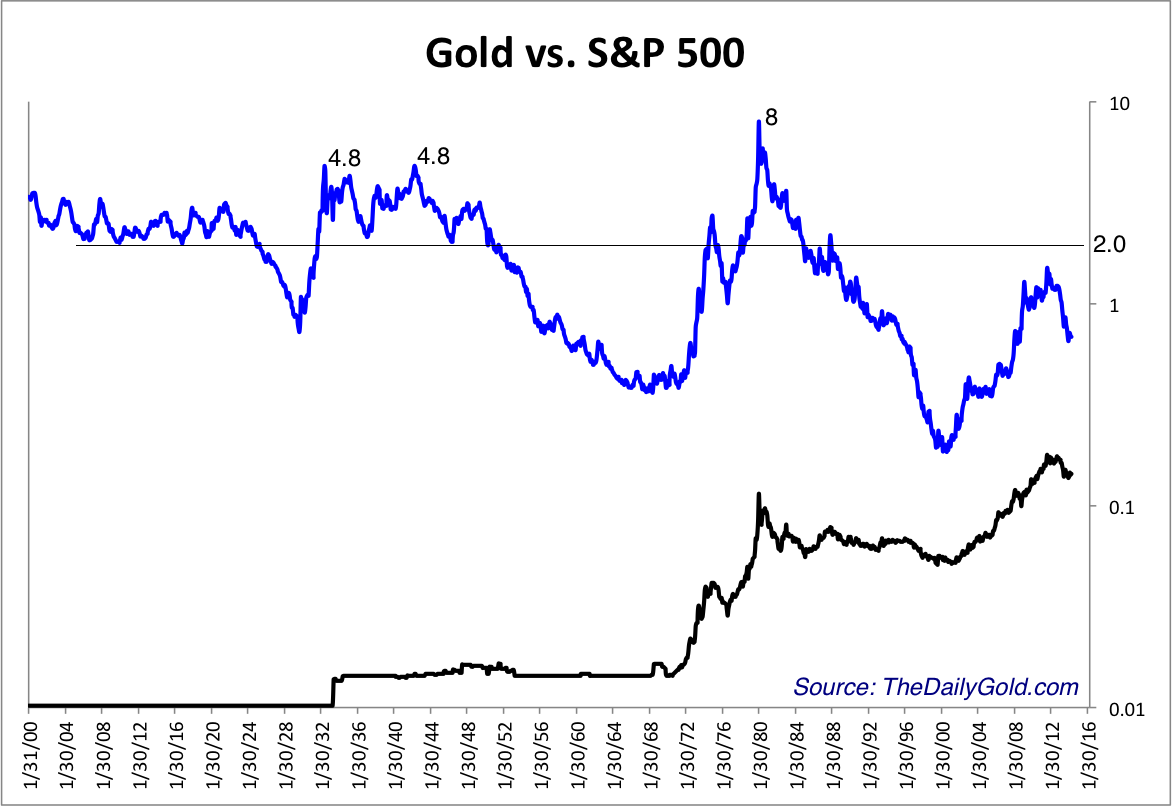
Gold vs. S&P 500 (Since 1900)
The data for this chart is from Nick Laird at ShareLynx.
The ratio peaked twice at 4.8 during the Great Depression and at 8 in 1980. It also peaked around 5.0 in 1896.
A ratio of 5.0 with an S&P price of 1300 (about 30% lower and the current 10-year moving average) gives a Gold price of $6500. A ratio of 2.0 and S&P 1500 (20% lower) gives a Gold price of $3000.