Gold’s Healthy Correction: Why the Bull Market May Still Be in Its Early Stages
Introduction
After the second greatest breakout in its history in March 2024, Gold has entered its first meaningful correction.
For many investors, pullbacks can feel uncomfortable, especially after strong gains. But in long-term bull markets, corrections are not only normal—they are essential.
History suggests that the current correction in gold may simply be the market catching its breath before the next major advance.
By examining historical breakouts, market cycles, and macroeconomic conditions, we can gain insight into where gold—and silver—may be headed over the next several years.
Gold’s Big Picture: A Historic Breakout and Its First Correction
Gold is currently experiencing its first intermediate-term correction since its major breakout roughly two years ago. Similar breakout periods in the past have led to some of the strongest multi-year advances in the metal.
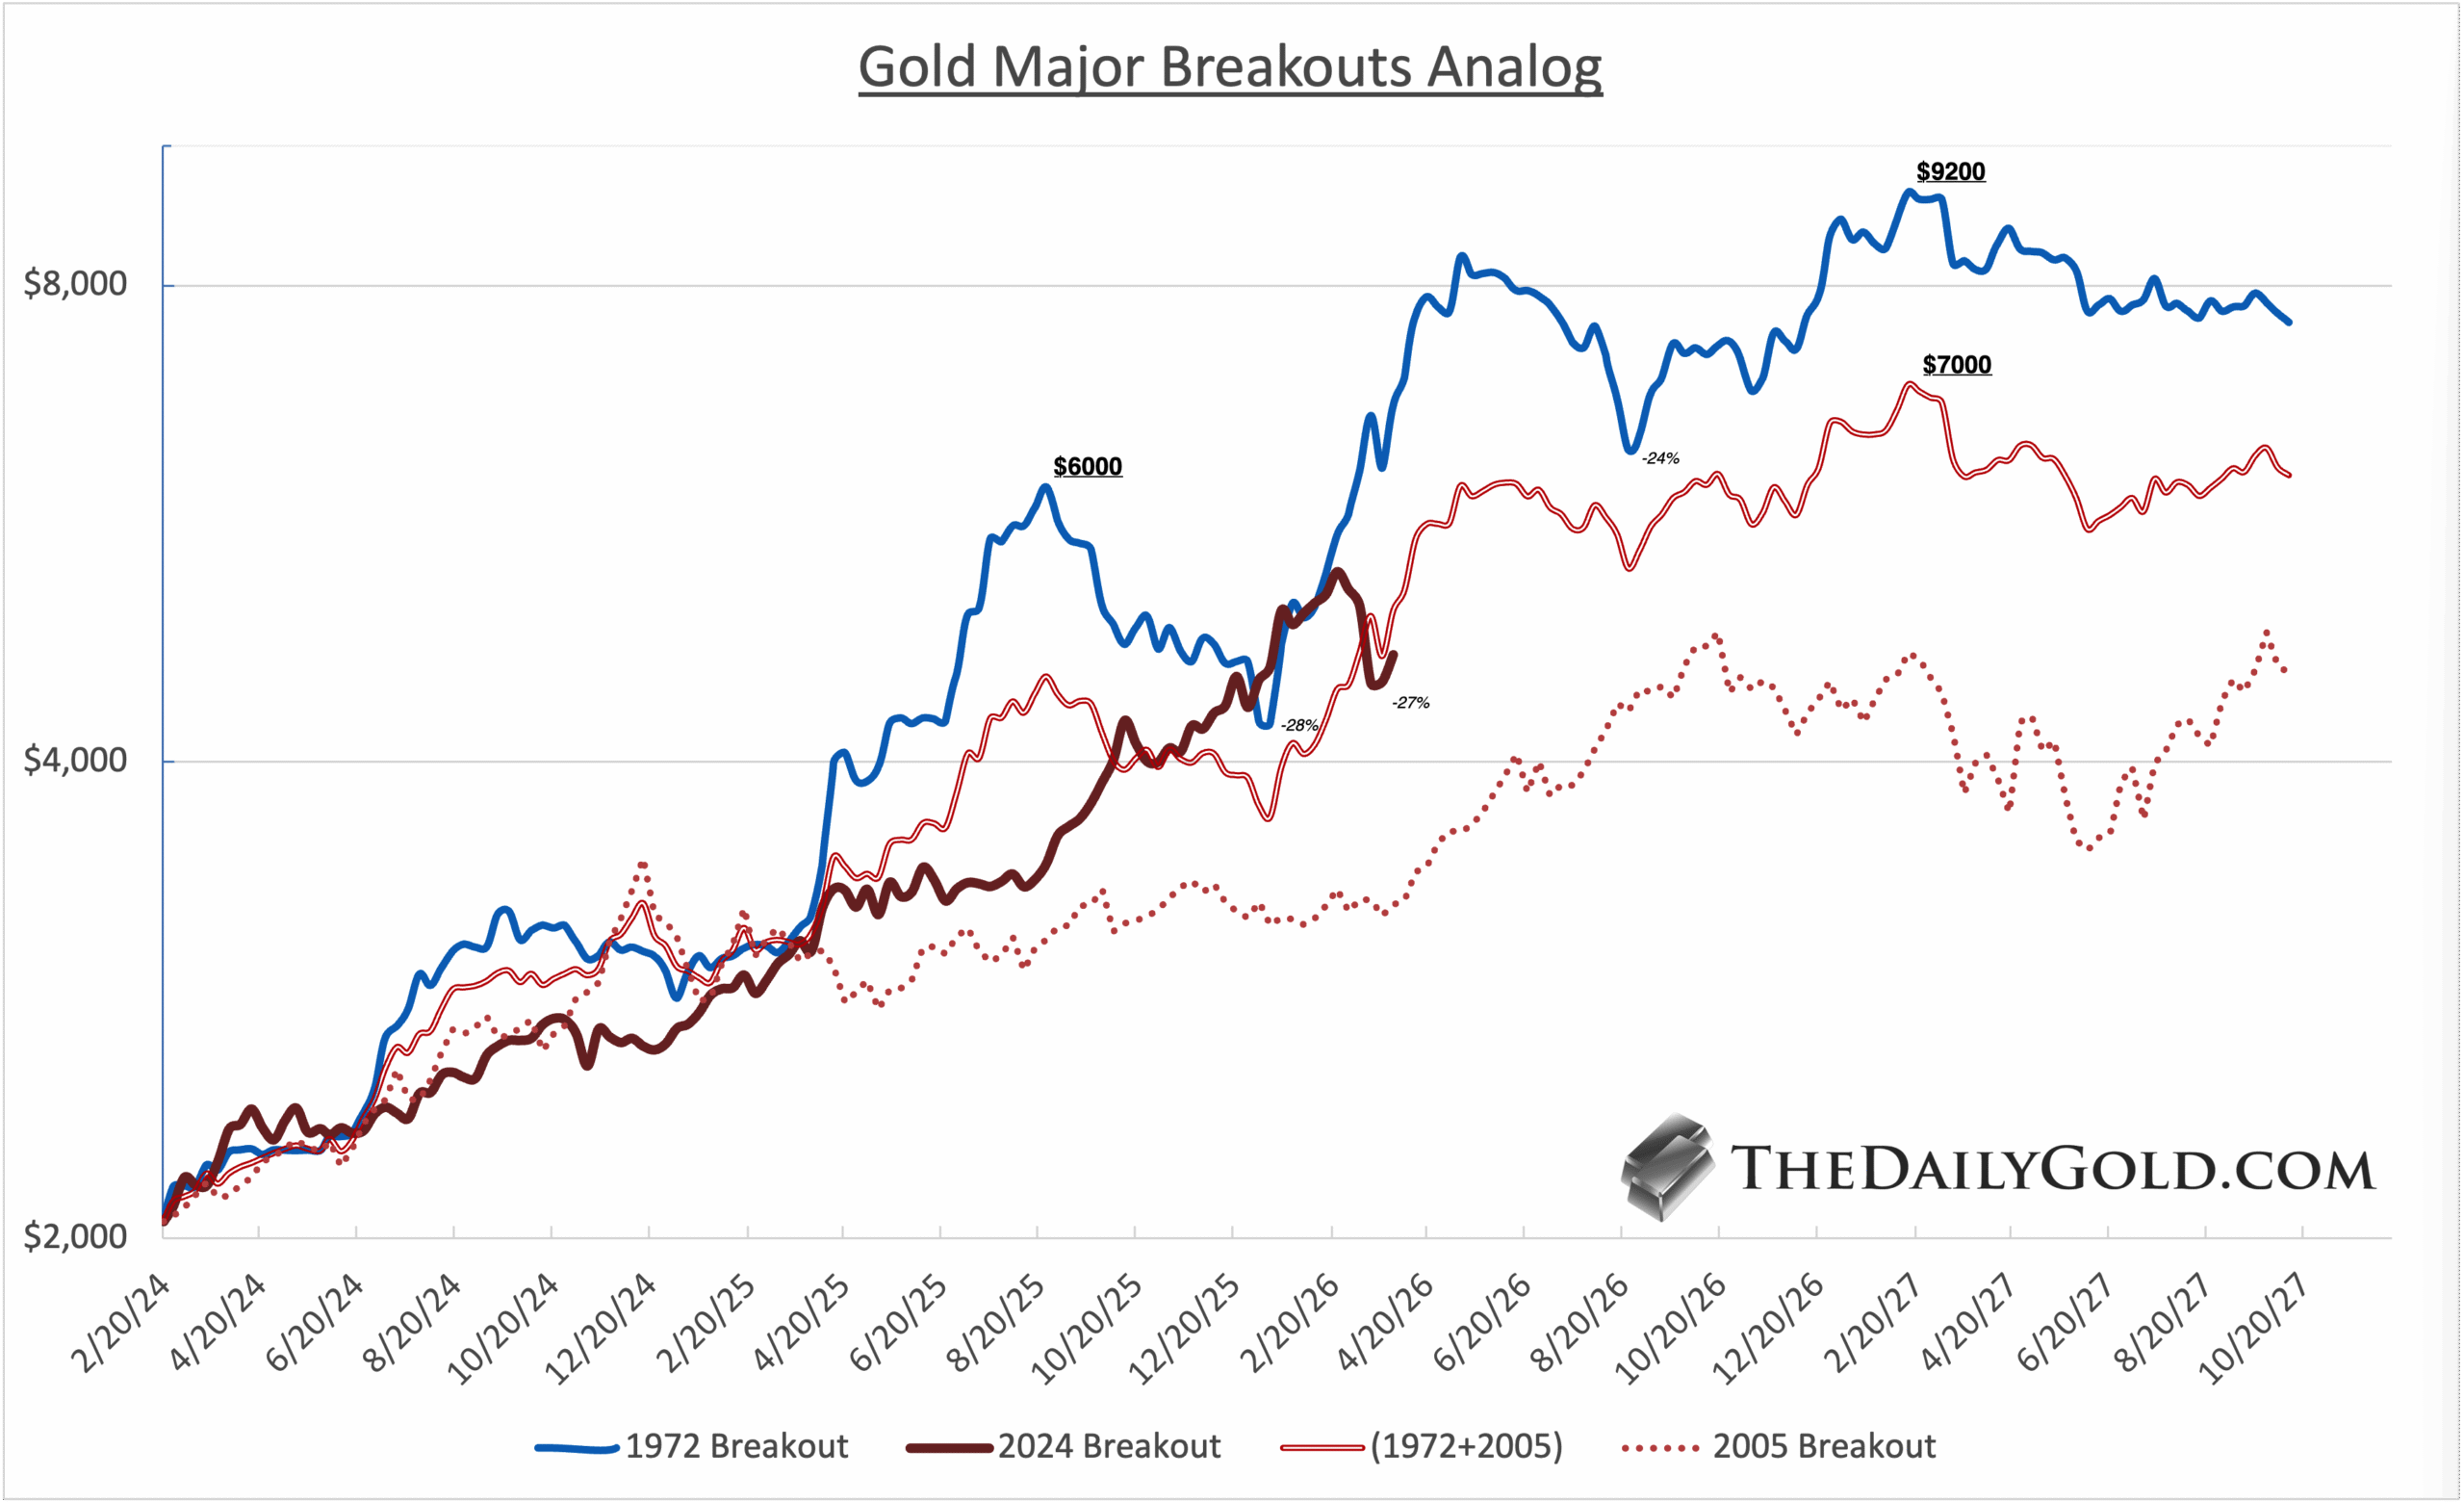
Two historical parallels stand out: the 1973 breakout and the 2024 breakout. Both periods triggered powerful two-year runs in gold prices.
In the 1973 cycle, gold surged dramatically before peaking—on the scale of the current breakout near $6,000, followed by a 28% correction.
Today’s correction has been remarkably similar, with gold declining roughly 27% so far. The magnitude of the drop is consistent with historical precedent, but the timing suggests the correction may not yet be complete.
When examining long-term historical analogs—including the 2005 breakout—gold’s trajectory still points toward a potential $7,000 price target by 2027.
Understanding Post-Breakout Corrections
Major breakouts in gold tend to follow a consistent pattern:
- Breakout
- Rapid surge
- Intermediate correction
- Bottom near the 200-day moving average
Looking back at two relevant historical examples:
- 1973: Gold corrected 28% over roughly five months
- 2006: Gold corrected 25% over roughly five months
The current correction closely mirrors those earlier cycles. The first leg down has likely already occurred. Notably, the bottom of that first phase arrived almost exactly when the 1973 correction bottomed and just days after the historical average timing.
If the pattern continues to hold, gold may now enter a sideways-to-lower drift lasting roughly another two to three months before completing the correction phase.
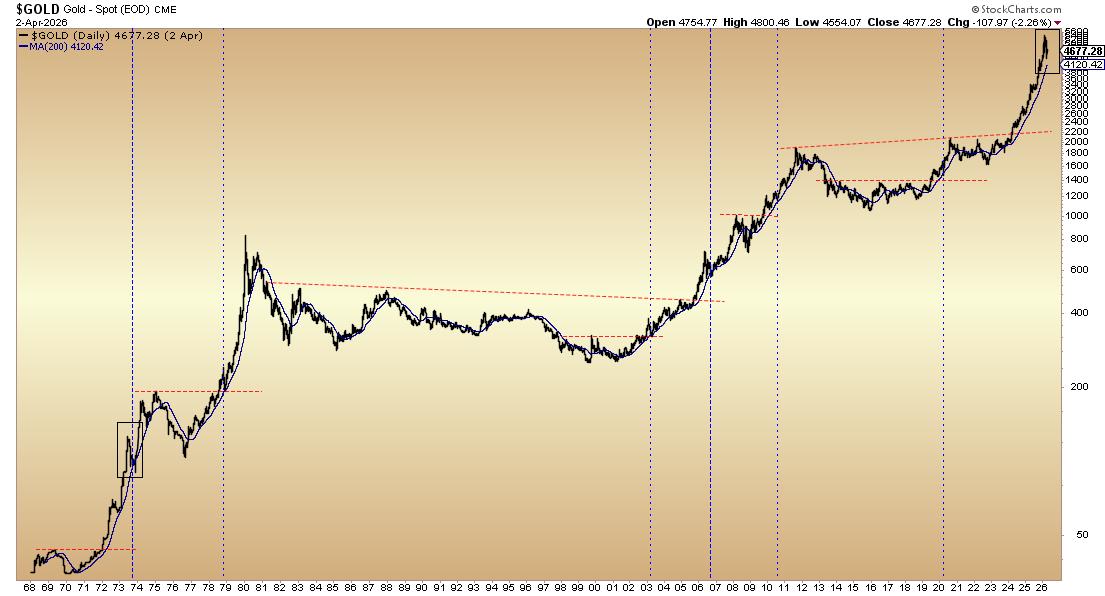
The Importance of the 200-Day Moving Average
Following major breakouts, Gold often retraces toward this level before the next leg higher begins. This test acts as a reset point where momentum cools and new buyers enter.
Gold futures briefly touched the 200-DMA intraday while spot Gold came very close to that level. Daily closing charts can sometimes obscure these tests because intraday moves are not captured fully.
With the 200-DMA rising steadily and gold likely drifting sideways to lower through the spring, the metal appears poised to complete its correction with a clean test of that support level.
It is important to note that Gold actually fell below the 200-DMA for a few weeks before making its final bottom in 1973 and 2006.
What Happens After the Correction?
Historically, once Gold tests its 200-day moving average following a breakout, the next phase of the bull market begins.
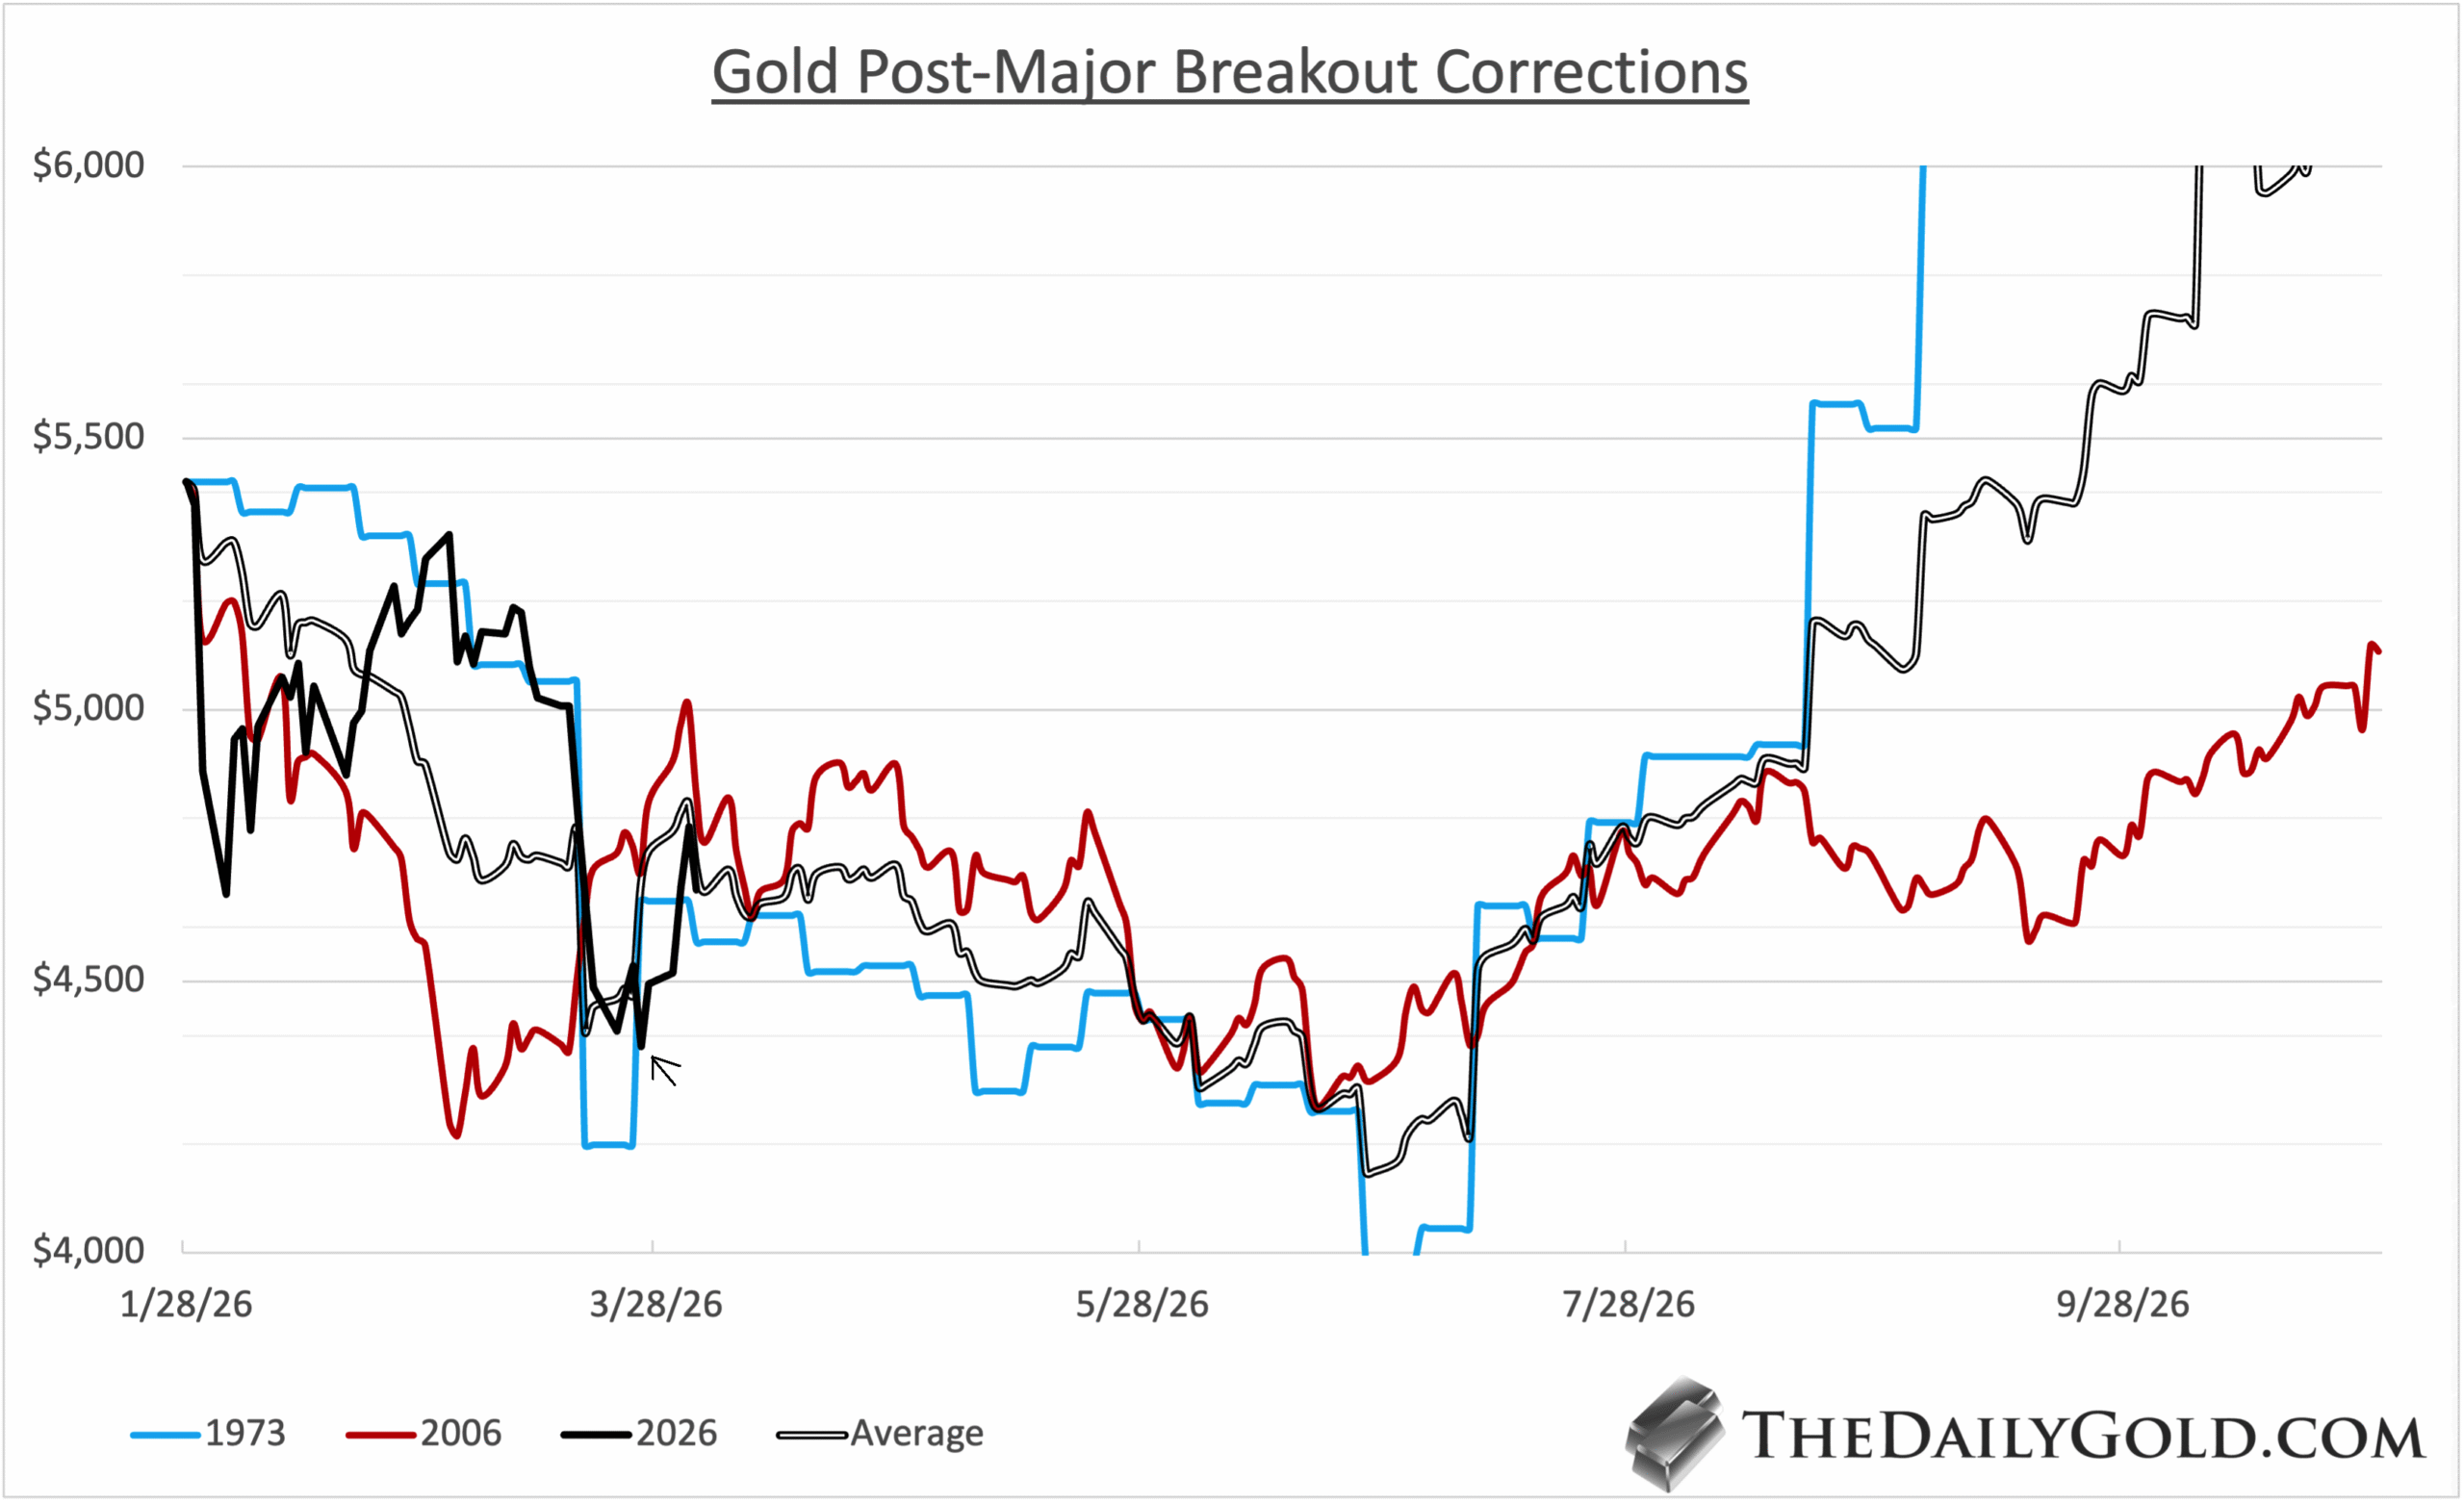
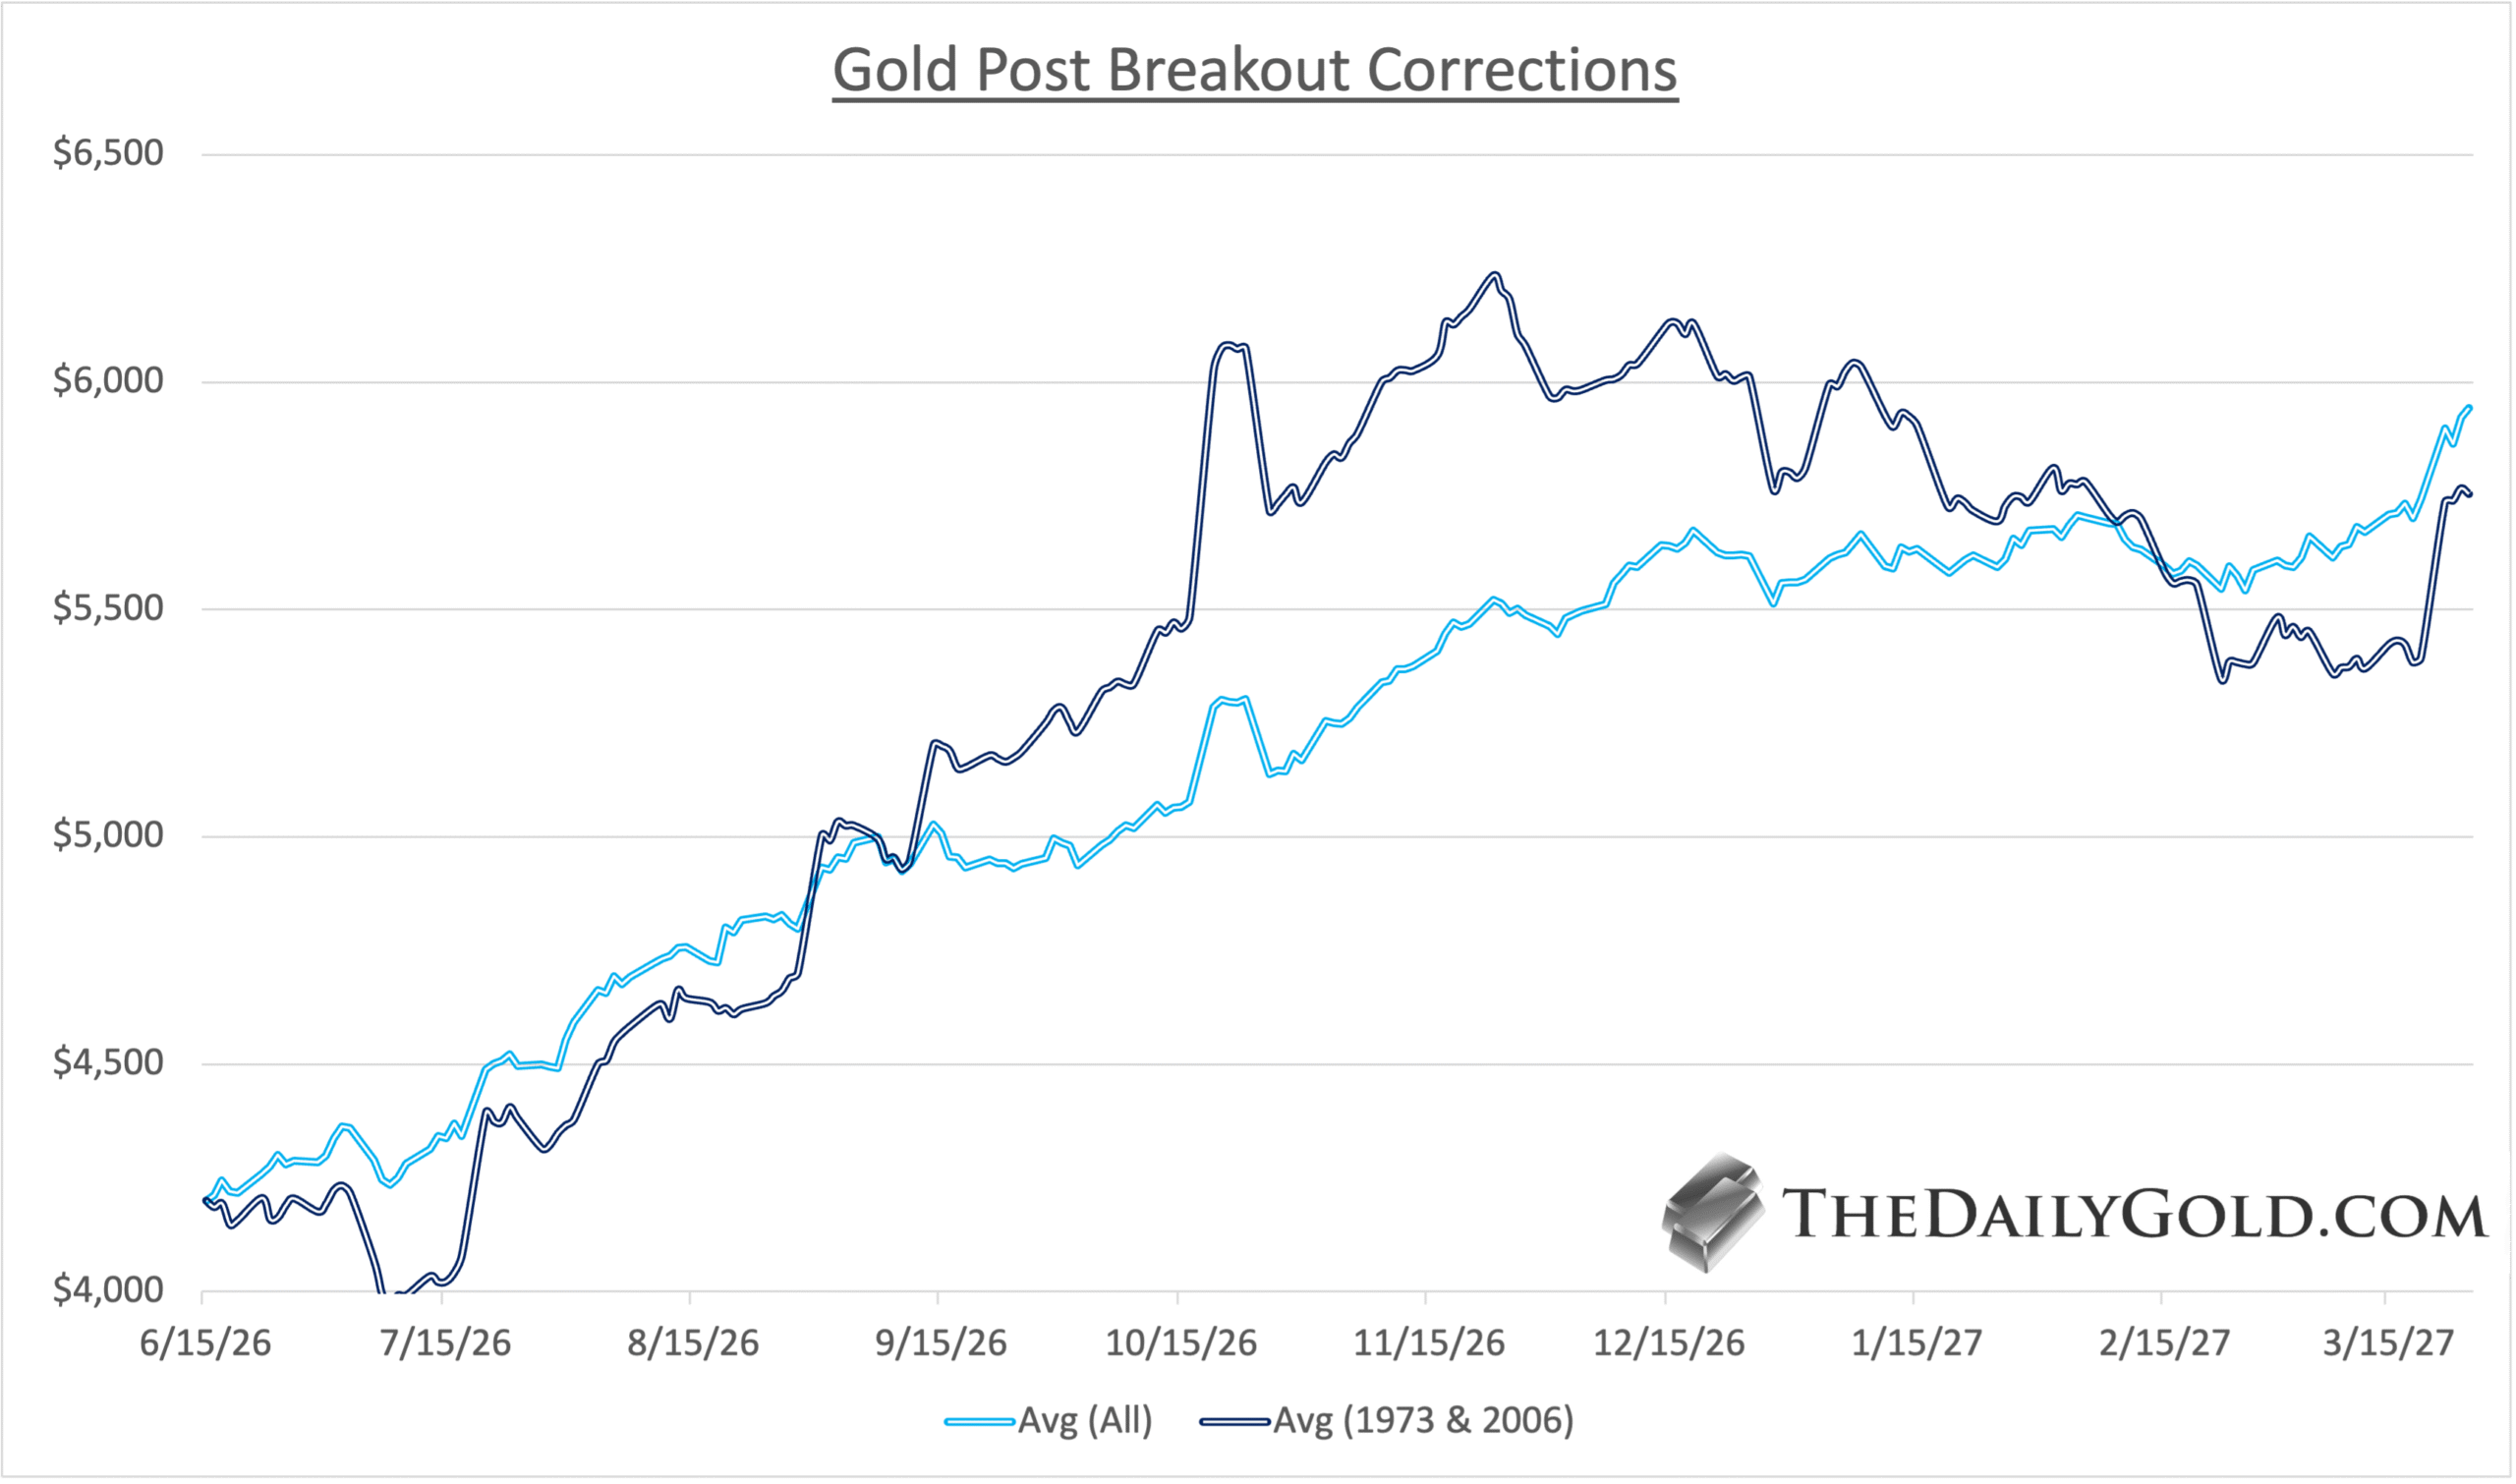
When charting rebounds following these corrections, two historical averages are particularly useful:
- The 1973 and 2006 corrections
- A broader average including corrections in 1978, 2003, 2010, and 2020
The first comparison—the 1973 and 2006 pattern—may provide the most realistic roadmap for the current cycle. These historical models suggest that once the correction completes, Gold can resume its longer-term advance with significant upside potential.
The chart assumes a Gold bottom at $4200 in mid-June. The average of the 1973 and 2006 post-correction rebounds would put Gold at $6000/oz in October 2026.
The Macro Environment: Inflation vs. Recession
While charts and technical patterns are useful, the macro-market environment also plays an important role in Gold’s trajectory.
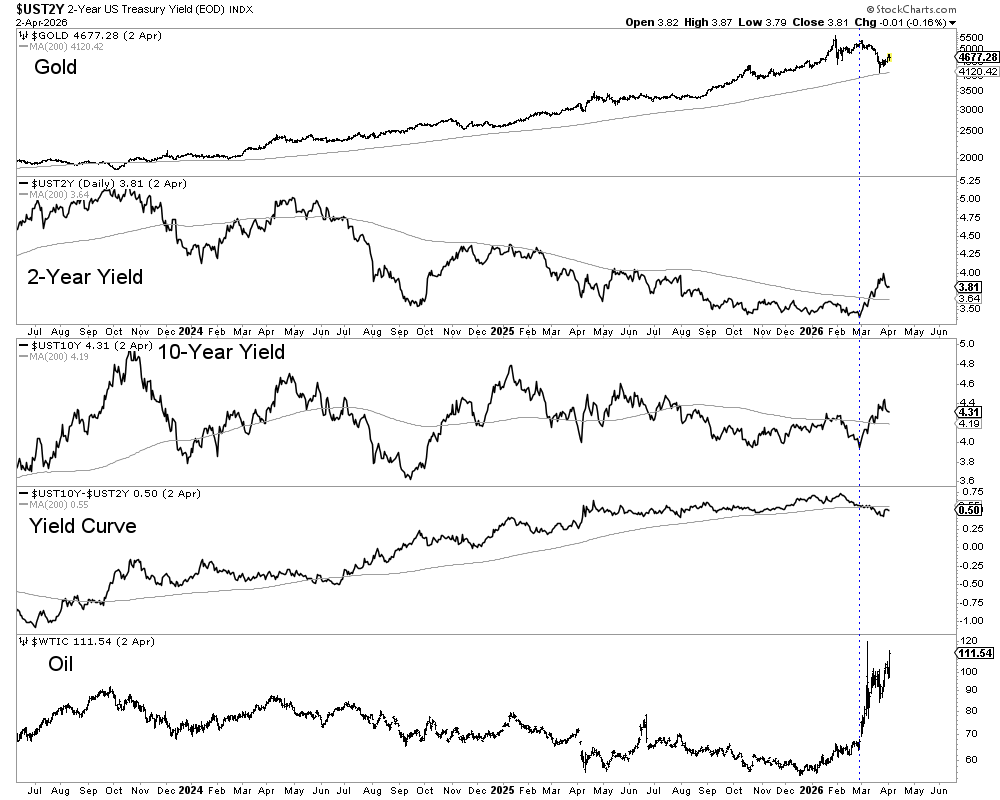
Currently the macro chain reaction looks something like this:
Rising oil prices → higher bond yields → rising inflation expectations → tighter Federal Reserve policy (for now).
This environment can temporarily pressure Gold.
However, the dynamic changes when the narrative shifts from inflation fears to recession fears.
Historically, that transition is when Gold and the broader precious metals sector tend to launch their next major move higher.
Silver’s Role in the Cycle
Silver at times behaves differently from Gold during major precious‑metal cycles.
After what appears to be a blow‑off top, most similar to 1974 and 2006, Silver is lagging Gold again.
Several observations stand out:
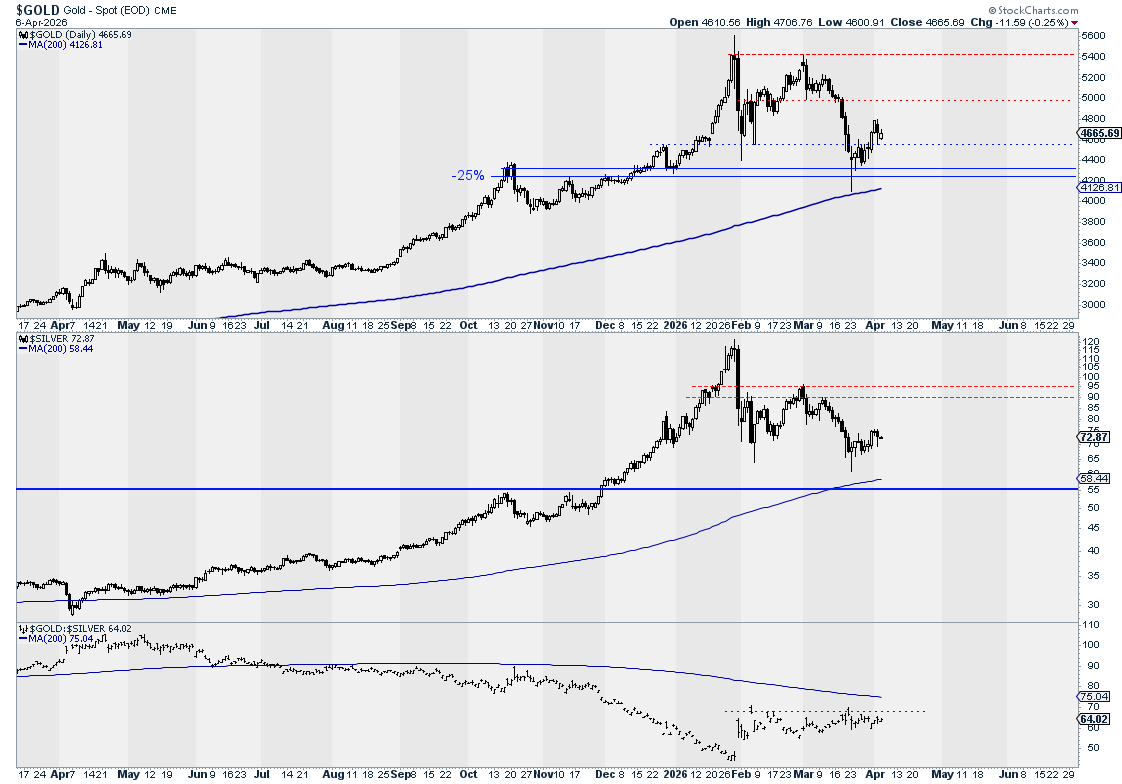
- The Gold/Silver ratio is consolidating in a bullish pattern
- The ratio’s measured upside target sits near 77
- Silver appears to have a strong price floor around $55
- The 200‑day moving average near $58 continues to rise
Silver may continue lagging Gold in the near term. A likely turning point would occur once gold breaks above $5,200–$5,400.
The Chronic Under‑Allocation to Gold
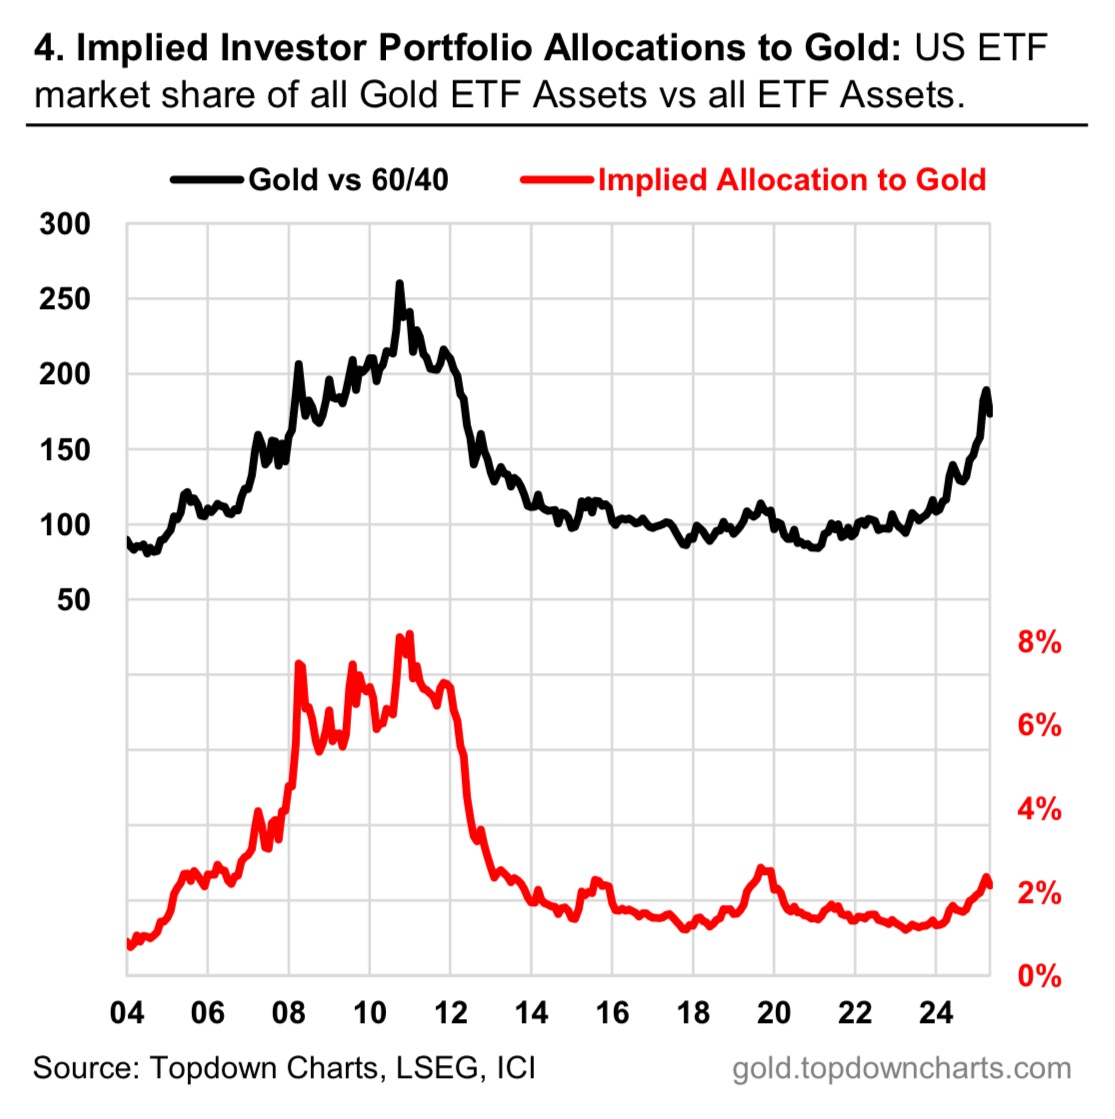
One of the most striking features of the current bull market is the lack of institutional allocation to gold.
Comparisons to 2011, 1980, or 1979 don’t hold up as money flows and allocations in recent years tell a completely different story.
The implied ETF allocation to Gold remains near 2%. This is below the 2019 peak and well below peaks in 2008 and 2011 around 8%.
Corrections like the one currently unfolding often deepen that under‑allocation—creating conditions that can fuel the next advance when sentiment shifts.
Conclusion
The current gold correction appears to be normal, healthy, and historically consistent.
Historical patterns suggest a few more months of consolidation before the correction completes, likely accompanied by a test and break of the rising 200‑day moving average.
Long‑term analogs still point toward a potential $7,000 gold price in 2027. Silver may lag in the near term but appears to have strong support between $55 and $60.
For investors, periods like this are often when the most important groundwork is laid. When sentiment cools and markets pause, disciplined research and careful portfolio positioning can prepare investors for the next major phase of the precious‑metals bull market.
Now is the time to rotate out of yesterday’s winners and into the potential big winners of the next few years. I am assessing the potential of all the stocks I own and follow.