Gold’s Leading Indicators Looking Better

Although yours truly has yet to completely jump on the bull bandwagon (which has revved up recently), I cannot ignore the positive fundamental and technical developments for precious metals.
On the fundamental side, the market is essentially pricing in no hikes for 2019 and the start of rate cuts in 2020. For Gold, that is a huge improvement from just a few months ago.
In regards to the technicals, there are positives and negatives. (But there were no real positives several months ago). Let me start with the positives.
Before Gold begins a bull market, it usually strengthens against foreign currencies and the stock market. Check the charts from 1999-2001 and 2008-2009.
At present, Gold against foreign currencies (FC) closed within a cent of a 20-month high. It is at a 20-month high in weekly and monthly terms. Meanwhile, Gold against the S&P 500 has surged above key resistance for the first time since 2016.
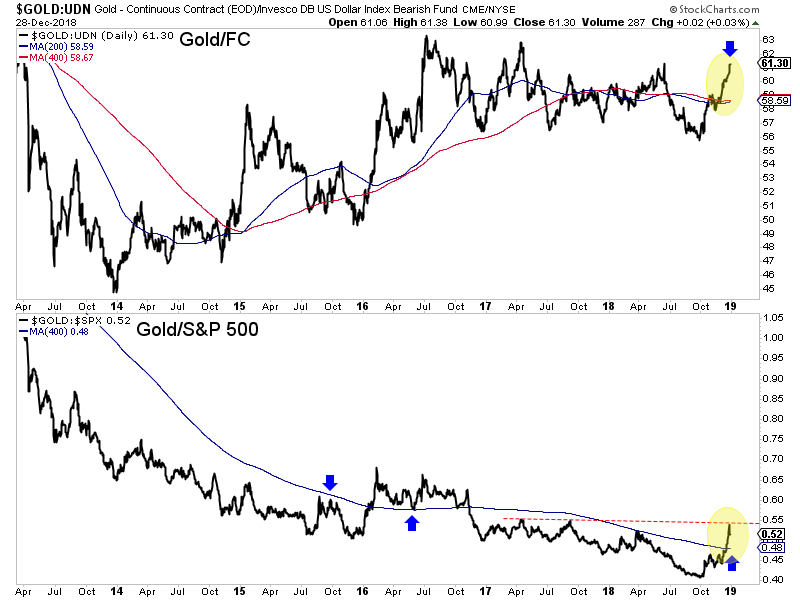
If Gold/FC can test and surpass its 2016 high and Gold/S&P 500 can surpass its 2017 peaks, then we’ll definitely be in bull market mode.
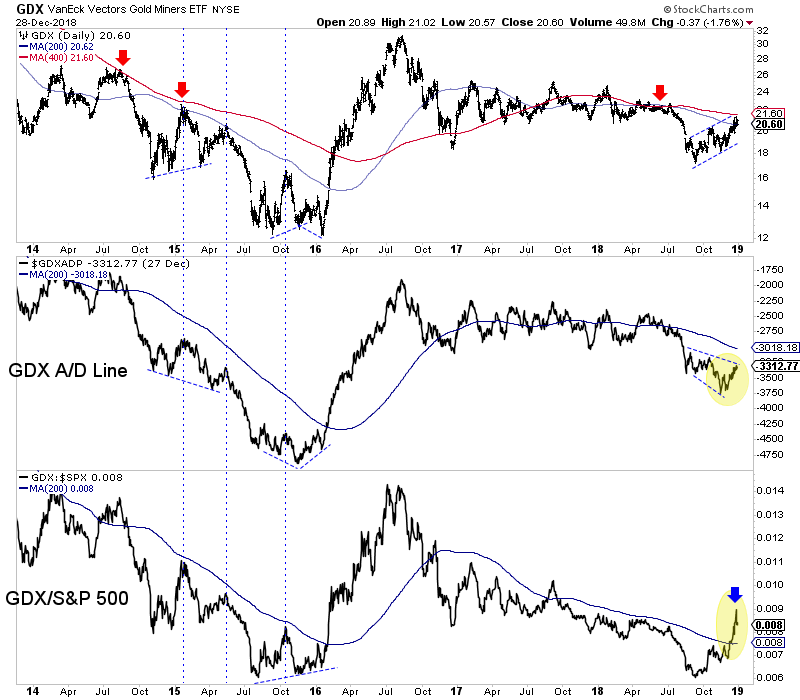
Turning to the gold stocks, we see a definite positive but also a negative.
Note how unlike in 2015, GDX relative to the stock market has broken out above its 200-day moving average. However, the advance decline continues to show a negative divergence.
In 2015 GDX rallied up to its 200-day moving average three times but each time a negative divergence with the advance decline line was in place. That line began to strengthen in November 2016 and the sector exploded two months later.
As 2019 beckons, Gold is trading within an area of strong resistance ($1260-$1300) and gold stocks (GDX, GDXJ) are battling moving average resistance while the oversold stock market is ripe for a positive first quarter.
Two things that could confirm a bull market in precious metals is fast approaching would be strong improvement in GDX’ advance decline line and the market pricing in no chance of a rate hike in 2019 and instead anticipating the potential for a rate cut in 2019.
In addition, even if the stock market performs well in the first quarter, it would be a bullish sign if Gold and gold stocks can hold above moving average support on those ratio charts. That would indicate the recent shift from stocks to Gold has traction and is not a flash in the pan. It would not be wise to chase strength until there is more evidence that a bull market has started. There will be plenty of time to get into cheap juniors that can triple and quadruple once things really get going. Note that many juniors began huge moves months after the January 2016 and October 2008 lows. To prepare yourself for some epic buying opportunities in junior gold and silver stocks in 2019, consider learning more about our premium service.