Gold’s Super Bullish Cup & Handle Pattern

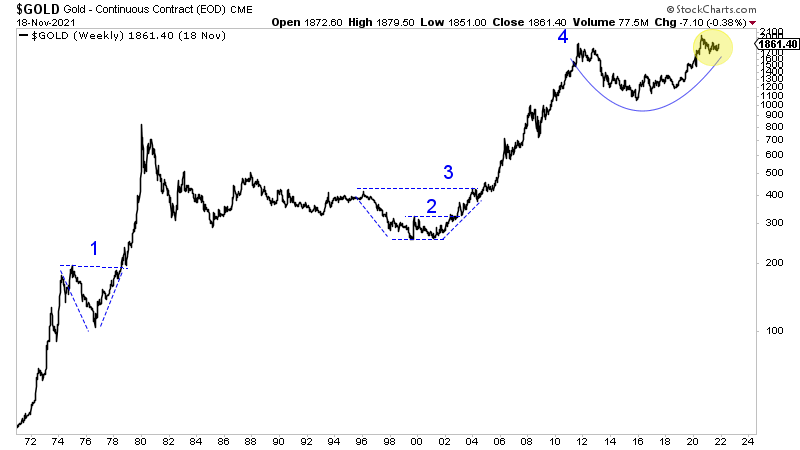
Gold is sporting a significant cup and handle pattern. It remains in the handle portion of the pattern.
Cup and handle patterns show up quite a bit but especially on smaller time frames.
There are not too many examples of a multi-year cup and handle pattern in the major markets.
Nevertheless, a study of some history reveals that most people do not understand how bullish this pattern is when it occurs over a long time frame. But let me digress.
The current cup and handle pattern in Gold projects to a measured upside target of around $3,000. That is an arithmetic target.
It’s also possible to get a logarithmic (log) target by measuring the percentage distance between the rim and bottom of the cup. If we do that, we get targets of $3,745 and $4,080 (depending on if we measure from 2011 high or 2020 high).
History shows that major, multi-year cup and handle patterns typically reach their arithmetic target quickly and the log target soon after.
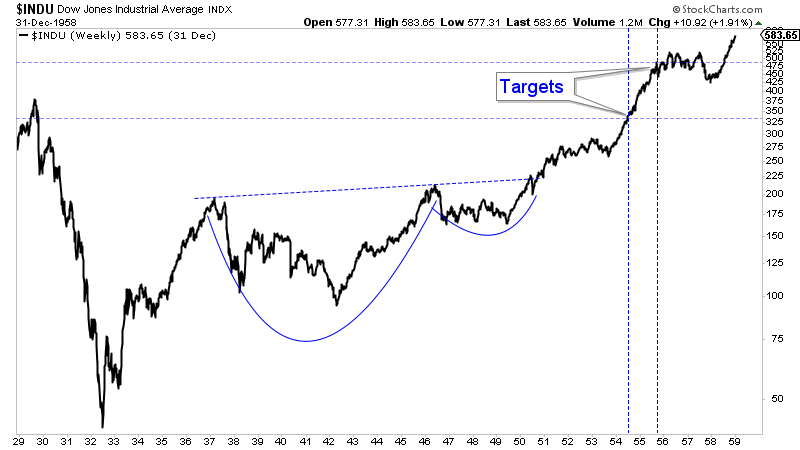
The best example of a historical cup and handle pattern is the stock market as the US exited the Great Depression. The cup lasted nine years, the handle four years, and the stock market hit the arithmetic target in four years and log target in over five years.

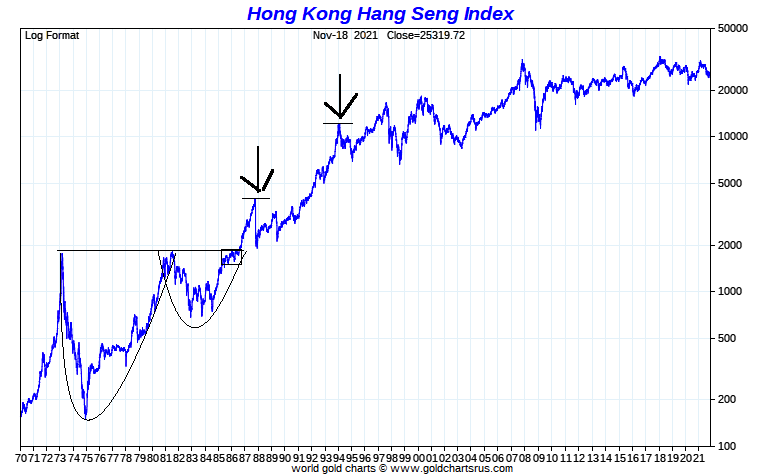
The Hang Seng formed two cups from 1973 to 1986. The first cup is more like the cup in Silver. The handle to that cup is part of its own cup and handle pattern.
That cup lasted four years (1981-1985), and a very bullish handle (in the form of a running correction) lasted a little over a year. The Hang Seng achieved its arithmetic target quickly and came within 12% of its log target before the crash of 1987.
Note, the much larger 13-year cup and handle pattern, following the 1986 breakout, gained over 6.5 fold in a little over the next seven years.

The other examples of historical cup and handle patterns are in Gold.
In the late 1970s, Gold exploded from a three-and-a-half year-long cup and handle pattern in which the handle was only four months long. Gold hit the log target only 15 months after the breakout.
The 1996 to 2005 cup and handle pattern was unconventional because it was a saucer bottom formation rather than a bullish continuation pattern. The cup lasted eight years and the handle 16 months. Gold reached both its arithmetic and log targets in only one year.

We know that Gold’s cup and handle pattern is a very bullish pattern as it has a measured upside target of $3,000. However, history shows that the target could be achieved quickly and then, soon after, the log target ($3,745 and $4,080).
History also indicates that Gold could rise beyond the log target. These cup and handle patterns were a springboard to levels well beyond the log target.
I have to be conservative as a counterbalance to the perma-bull gold bug universe but make no mistake. If and when Gold breaks out of this pattern, it will begin the most explosive move we’ve seen in 40 years. And that would only be the beginning.
Fortunately, there is still time to get on board as a breakout past $2,100 could be several months or a year away.
Although many of our stocks have moved up, plenty of quality opportunities remain. I continue to be laser-focused on finding quality juniors with at least 5 to 7 bagger potential over the next few years. To learn the stocks we own and intend to buy, with at least 5x upside potential after this correction, consider learning more about our premium service.


