Monthly Charts Clarify Prognosis for Gold & Silver
We’ve been surprised at the recent action in the precious metals complex. During the recent correction the shares were showing quite a bit more strength than the metals. Then the shares took a dive below support yet the metals maintained their recent lows! How do we interpret this wild volatility in the relationship between the shares and the metals? Quite often we look at daily and weekly charts. Now is the time to take a look at the monthly charts which can help us get a better read on the larger trends at hand.
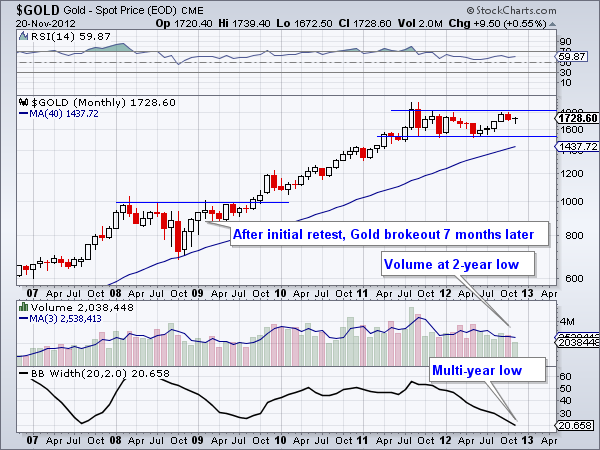
The monthly chart of Gold shows the yellow metal in a very healthy consolidation between $1550 and $1800. Gold’s current retreat from $1800 has lasted two months. Back in 2009, Gold brokeout to a new all-time high in the seventh month of its consolidation. Presently, Gold’s bollinger band width is at a multi-year low and its three-month volume average is at a two year low. Also, the RSI has bottomed and made a higher low. Even if Gold touched $1600, it would remain in healthy position for a breakout in 2013.
Gold’s companion Silver is currently trading in a tighter consolidation with $35 as resistance and $27 as support. Note that Silver has tested and held above $27 six times in the last fifteen months. Silver also held above the rising 40-month moving average which supported the market in 2009 and 2010. The RSI has also made a higher low and volume has trended down during the past seven months.

Meanwhile, the gold stocks (HUI) look weaker than the metals. Momentum hasn’t confirmed its bottom as the market is in a clear range from 400 (support) and 525 (resistance). Note the current 11% decline in the HUI for the month while Gold and Silver are still in positive territory. Nevertheless, if and when the HUI prints a monthly close above 525, this chart would like quite bullish and general sentiment would certainly pick up.

The evidence argues that the bottoms remain well intact and the metals are consolidating before the next breakout which entails Gold breaking $1800 and Silver $35. However, these breakouts are by no means imminent. Since we are dealing with monthly charts that means potentially three or four more months of consolidation. Furthermore, sentiment data such as the COT structure and public opinion polls need some improvement before the market could sustain a breakout. Thus, more consolidation could be the order of the day for the metals.
Continued consolidation in the metals also helps explain recent weakness in the HUI, which is simply testing the lower half of its own consolidation. The shares see the weakness in the overall market and perhaps sense that an immediate breakout in the metals is unlikely Furthermore, while central banks have put themselves in position to act they haven’t actually done anything yet. When the market senses their action it will likely mark a final low within this consolidation.
The good news is the metals remain in fine shape and so to do most of the mining equities we follow. If we are indeed correct that the metals and shares will remain range bound then your task is simple. Prepare yourself for further consolidation by having your buy list ready and then be ready to act when the time comes. A wise friend once told me that in a bull market the goal is to accumulate positions at the lowest prices possible. With mining equities trading well off their highs, now is the time to do your research and find the companies that will lead the next leg higher and outperform the gold stock sector. If you’d be interested in professional guidance in uncovering the producers and explorers poised for big gains then we invite you to learn more about our service.
Good Luck!
Jordan Roy-Byrne, CMT
Jordan@TheDailyGold.com