How Much Can GDX & GDXJ Gain in 2014?
In recent months we compared the bear market in gold stocks to bear markets of the past. Readers were probably getting sick of seeing our bear analogs chart which made the case that a major bottom was coming. The good news is the major bottom is in and now we can compare the current recovery with past recoveries. GDX and GDXJ continue to form a very bullish bottoming pattern and we want to see how their measured targets (and potential upside) mesh with historical recoveries.
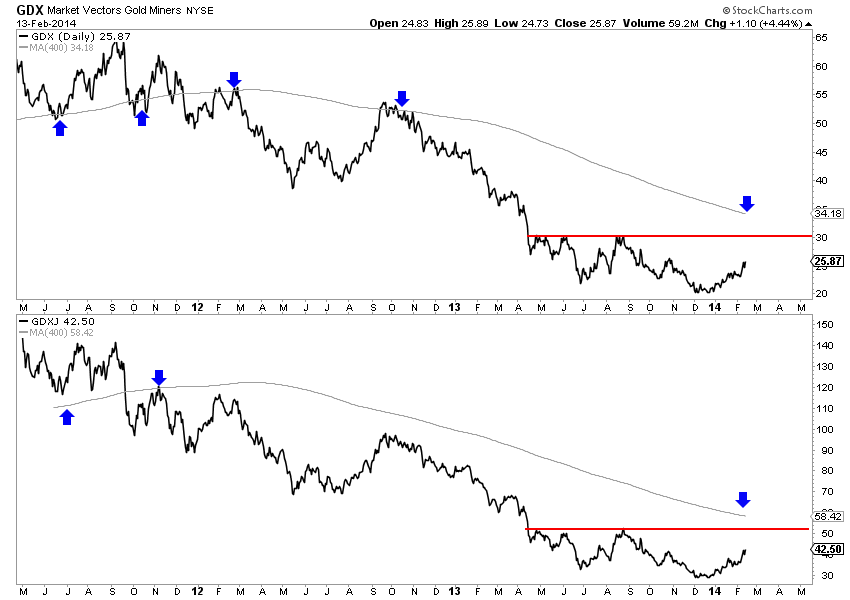
The following chart plots GDX and GDXJ as well as their 400-day moving average, one of my favorite long-term moving averages. Both markets could be forming reverse head and shoulder bottoming patterns. The necklines are the next resistance targets at $30 for GDX and $51 for GDXJ. These targets could coincide in the near future with the declining 400-day moving averages. The left shoulder of the pattern was formed in June 2013 and the head was formed in December. The right shoulder could be formed from a pullback from those aforementioned targets. The pattern projects to upside targets of $40 for GDX and $73 for GDXJ.
Next, we plot the same markets on a monthly chart. The next major (or multiyear) resistance for GDX and GDXJ are essentially the same upside targets from the potential head and shoulders patterns.
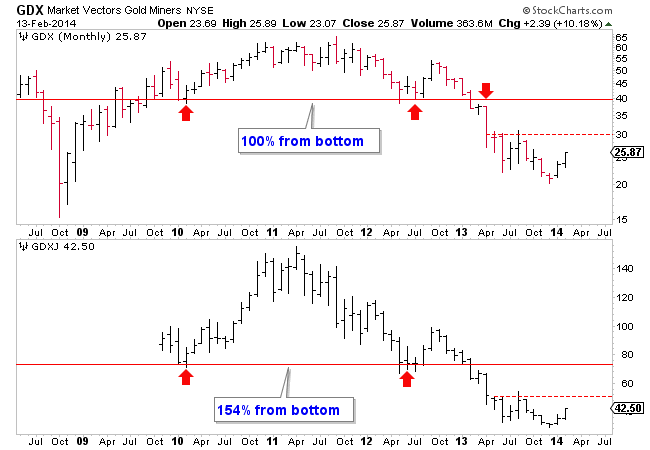
The targets equate to a 100% rebound for GDX and over a 150% rebound for GDXJ. This seems excessive but history argues otherwise.
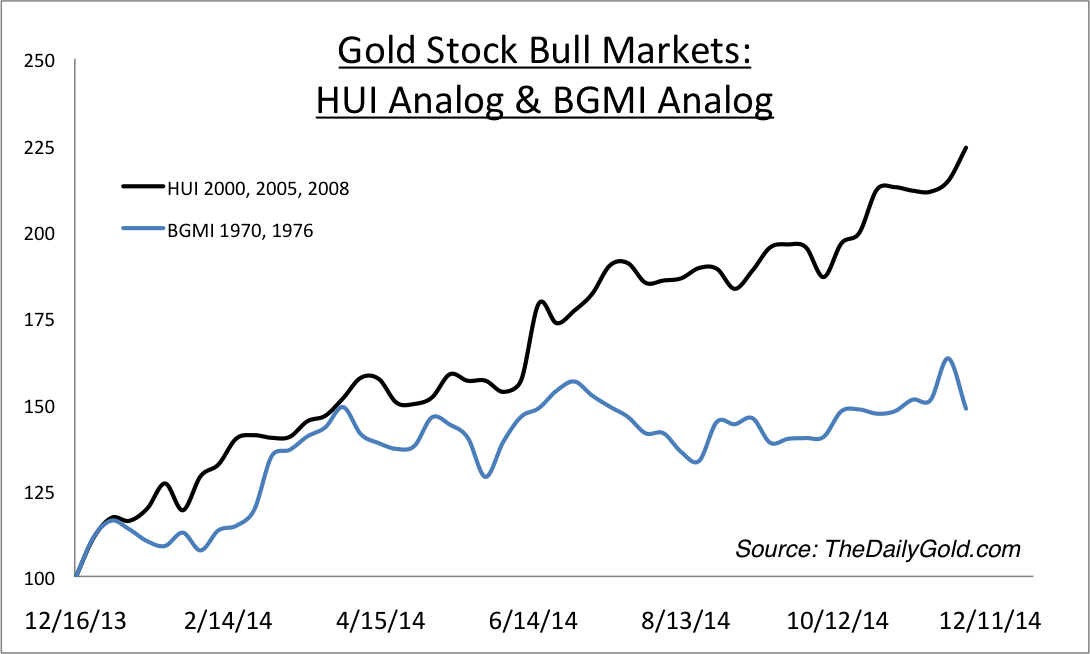
In the chart below we plot the average rebound in gold stocks from major bottoms within secular bull markets. In black we plot the average of the 2000, 2005 and 2008 rebounds and in blue we plot the average of the 1970 and 1976 rebounds using the Barron’s Gold Mining Index. Over the past decade, the HUI averaged a 125% rebound in 12 months while the BGMI averaged about a 60% rebound. We should note that the HUI is a more volatile and leveraged index than the BGMI. A 60% rebound in the BGMI could equate to an +75% rebound in the HUI.
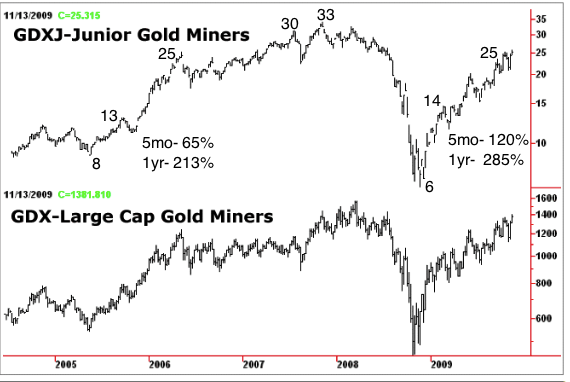
GDXJ does not have as much of a history but thanks to Bob Hoye we can see how it performed following the 2008 and 2005 bottoms. He took the GDXJ components and weightings from 2009 and projected it back to 2004. GDXJ rebounded over 200% following both the 2005 and 2008 bottoms. The chart is Bob’s and the annotations are ours.
Historical analysis shows that the potential upside targets of GDX $40 and GDXJ $73 could be achieved by the end of this year. That would mark a 100% gain for GDX and over 150% rebound for GDXJ in one year. Forecasting these gains is perfectly reasonable given history. A one year gain of 100% in GDX would be below the average of the one year rebounds in 2000, 2005 and 2008. A gain of 150% in one year for GDXJ would be below what its performance following the 2005 and 2008 bottoms.
GDX and GDXJ should continue higher in the short-term until GDX $30 and GDXJ $51. That is 16% and 20% upside respectively. A pullback would create a buying opportunity for those who have missed out and set up the right shoulder of the inverse head and shoulders pattern. Both the short and intermediate term outlook for gold and silver stocks continues to be very positive. Don’t overthink it. Be long, sit tight and have an exit strategy in case things play out differently. If you’d be interested in learning about the companies poised to outperform the sector, then we invite you to learn more about our service.
Good Luck!
Jordan Roy-Byrne, CMT