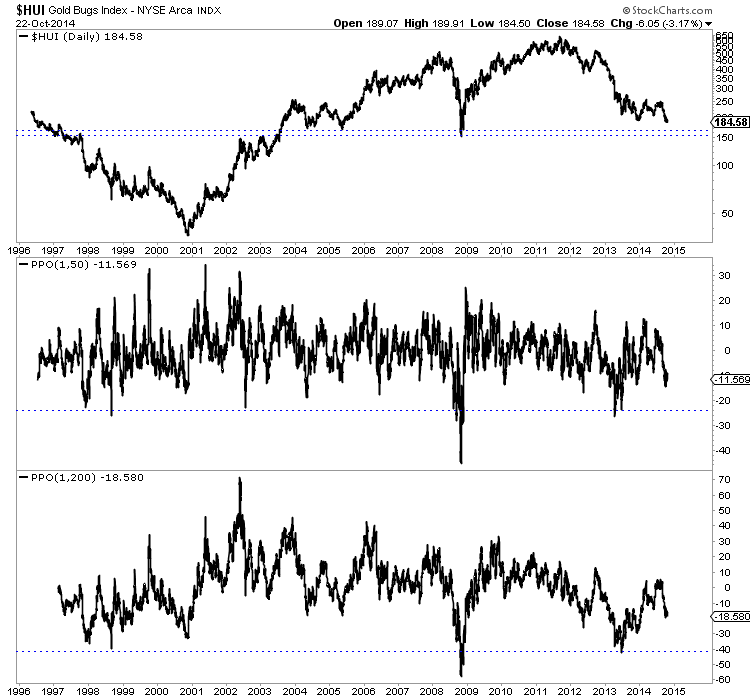
HUI Gold Bugs Index Distance from 50-Day & 200-Day MA
I did not know that this statistic could be found using stockcharts.com’s PPO indicator. Below is a chart of the HUI Gold Bugs index that shows two other plots: its distance from its 50-dma and its distance from its 200-dma. These indicators help us measure overbought and oversold conditions. The HUI is very oversold but its nowhere near as oversold as it was in 2013 (according to these two statistics).