Potential Path of Gold’s Coming Rebound
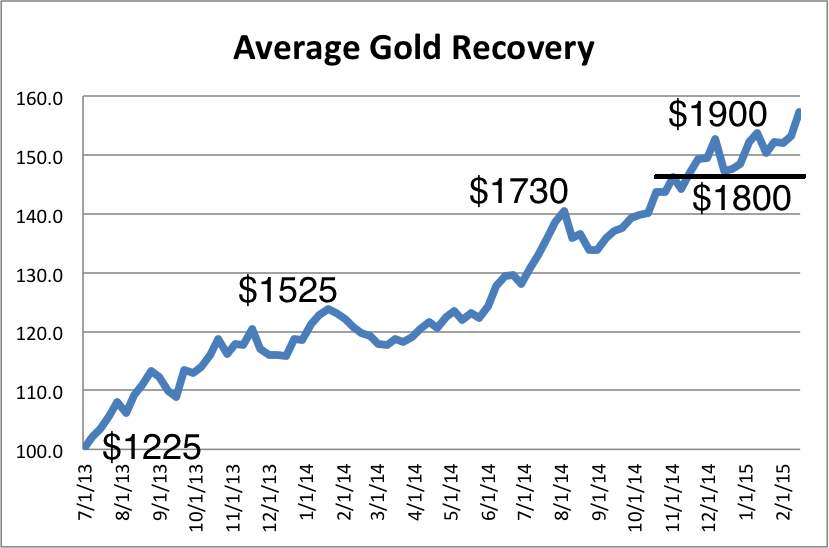
We looked at Gold’s price action following three bottoms: early 2004, October 2006 and October 2008. We took the weekly data, weighted it equally and combined it into one chart. We put the equivalent targets on the chart. Our assumption is that Gold starts on July 1 at $1225. These are weekly prices. Gold may bottom at $1200 but its weekly low may be $1225. Gold closed this week at $1296. A drop to $1225 is 5.5%.
Following the 1976 bottom, Gold rallied over 80% in 18 months. More important to this study is the fact that it took Gold 18 months (from the bottom) to reach its previous high or three years from the preceding top. The chart below shows Gold potentially reaching $1900 in February 2015 which would be 19 months from the bottom and nearly three and a half years from the summer 2011 top.
I think this chart makes sense. Gold should be able to rally back to $1550 but then we can expect some resistance to set in. Stronger momentum and positive sentiment would come into play about 11 months from now.