Precious Metals Have Not Corrected Enough

Precious Metals enjoyed a very strong move this past summer. Both Gold and gold stocks broke past multi-year resistance and showed the kind of positive momentum that has been lacking for years.
But strong momentum coupled with major technical resistance set in, along with a temporary shift in fundamentals, thus creating a roadblock and a correction. The precious metals complex has corrected some but our work argues they’ve not corrected enough.
First, let’s take a look at Gold and gold sentiment.
While Gold has corrected, it has managed to hang around close to $1500/oz. That being said, Gold has weakened in real terms and that plus the larger correction in the miners argues Gold has more downside.
Gold hit strong resistance around $1550/oz and its sustained correction should lead to a retest of the previous breakout at $1400/oz or even $1375/oz, where there is an incredibly strong confluence of support.

Gold sentiment indicators also argue that the correction has more to go.
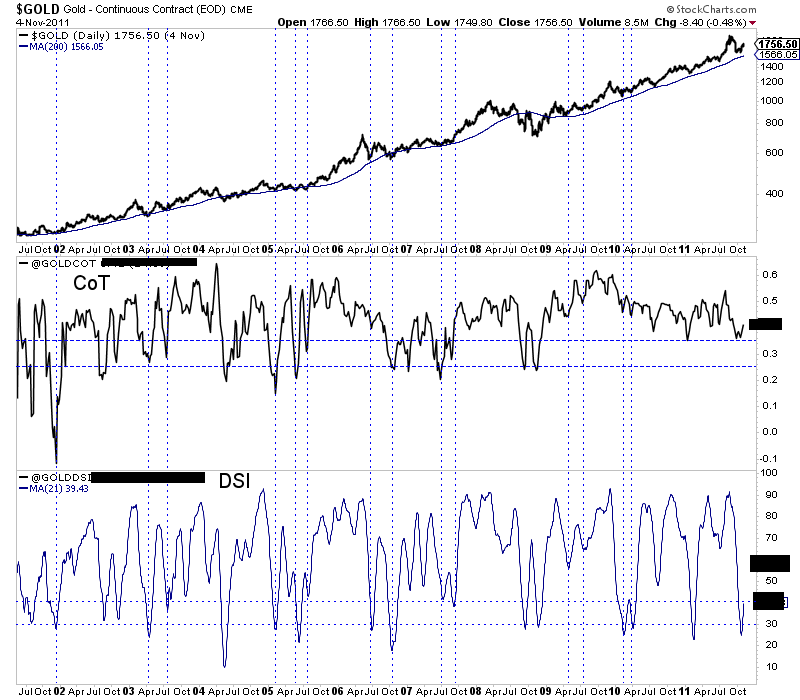
In the chart below we plot the Gold CoT and the 21-day Gold DSI (daily sentiment index) from 2001 through 2011. We marked (with vertical lines) comparable corrective lows in Gold during its bull run.
Note the levels of the Gold CoT and Gold DSI at those points. For the CoT we see various lows at 25% to 35% and for the DSI we quite a few lows around 30%.
At present, the 21-day Gold DSI is at 41% and the net speculative position (Gold CoT) was last at 47%. These figures need to decline another 10%.
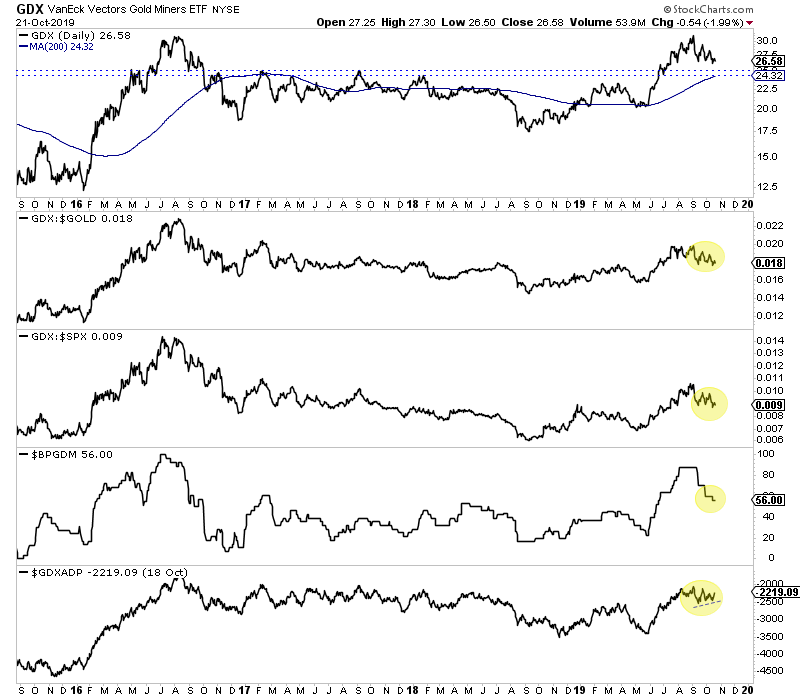
Turning to the gold stocks and specifically GDX, there is little reason to think its correction is complete.
The advance decline line for GDX is showing a positive divergence but we do not see anything of the sort as far as GDX against both Gold and the stock market. Also, the bullish percent index (which often hits 20% to 40% during corrective lows in primary uptrends) is at 56%.
The strong confluence of support for GDX is at $24-$25. Those levels mark previous multi-year resistance, the 38% retracement from the 2016 low, the 50% retracement from the 2018 low and include the 200-day moving average.
The evidence is quite strong that the correction in Gold and gold stocks has more to go in terms of price and probably time. This isn’t out of the ordinary as there were a handful of multi-month corrections and consolidations during the bull years in 2000s.
Simply put, the first buying opportunity should be if and when Gold and gold stocks test those support targets.
As the correction continues, better value and new opportunities will continue to emerge. That’s what I’m focused on right now. To learn the stocks we own and intend to buy that have 3x to 5x potential, consider learning more about our premium service.