Predictions of the Gold-Silver Ratio
05/06/11 Baltimore, Maryland – Today, traders are celebrating that the U.S. economy added the most jobs in nearly a year. Or so they’re led to believe. Let’s examine the payroll data first:
- The economy supposedly added 244,000 jobs in April. The private sector added 268,000 jobs; government cut 24,000
- However, 175,000 of those new jobs can be attributed to the BLS’ “birth/death model” – in which the economists guess at the numbers based on the launch of new businesses and the demise of old ones.
In other words, nearly three-quarters of these new jobs are a statistical invention. And most of the rest are the 62,000 people McDonald’s hired in a one-day job fair publicity stunt.
The separate household survey is nothing to write home about, however:
- U-3 unemployment, the number the media latch onto, rose to from 8.8% to 9.0%
- U-6, the more honest figure that includes people who’ve given up looking for work and part-timers who want to work full-time, rose from 15.7% to 15.9%.
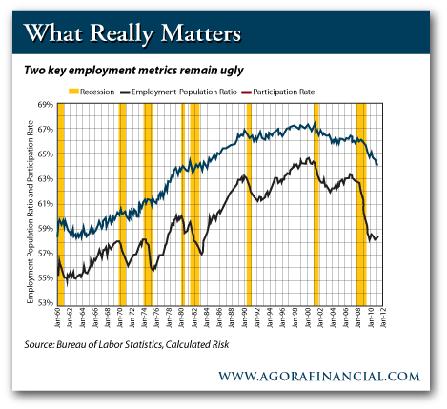
As always in these situations, we turn to the two figures the statisticians can’t game:

The red line is the percentage of the working-age population in the labor force. The black line is the employment rate of the overall population. Both lines are stuck at the same level they were when Hollywood inflicted the first Police Academy movie on an unsuspecting populace and Paul Volcker was getting kudos for “slaying inflation.”
But as long as the narrative is that job growth is on track – whew, what a turnaround in just 24 hours – we will get results like this…
- The major stock indexes have recovered most of yesterday’s losses. The S&P is back above the key level of 1,344
- Gold is within $5 of $1,500 again, and silver pushed past $36
- Copper, which fell below $4 a pound yesterday, is back above it today
- Crude oil is only 30 cents away from $100 again.
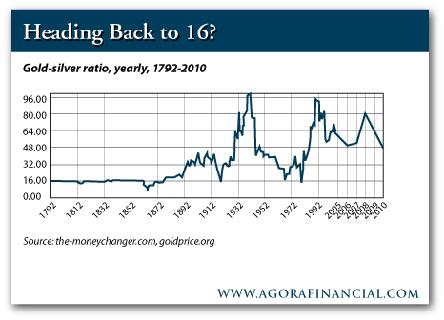
After this correction, the gold-silver ratio – very simply, the dollar price of gold divided by the dollar price of silver – is back to 41 this morning. One week ago today, when the metals were at record highs, the ratio was 32.
This number is important in terms of the long-term trend. A few years ago, Tennessee bullion dealer Franklin Sanders assembled this chart going back to the Coinage Act of 1792. We’ve updated it to the present day:

In the century since the creation of the Federal Reserve, the ratio’s been all over the place. The key is that it’s bottomed at or around 16 three times in the last century – 1919, 1968 and 1980.
Sanders is among many who believe long term, it’s headed back toward 16. Canadian fund genius Eric Sprott is another. Sixteen was the ratio for centuries before massive silver discoveries in the Americas in the 1800s.
With gold at $1,500 today, a 16:1 gold-silver ratio implies $94 silver. That’s a compelling case for silver… and with the ratio reverting for the moment above 40, silver’s on sale.
Read more: Predictions of the Gold-Silver Ratio http://dailyreckoning.com/predictions-of-the-gold-silver-ratio/#ixzz1LdzA7a00


