Relative Strength in Gold Stocks Portends to Rebound
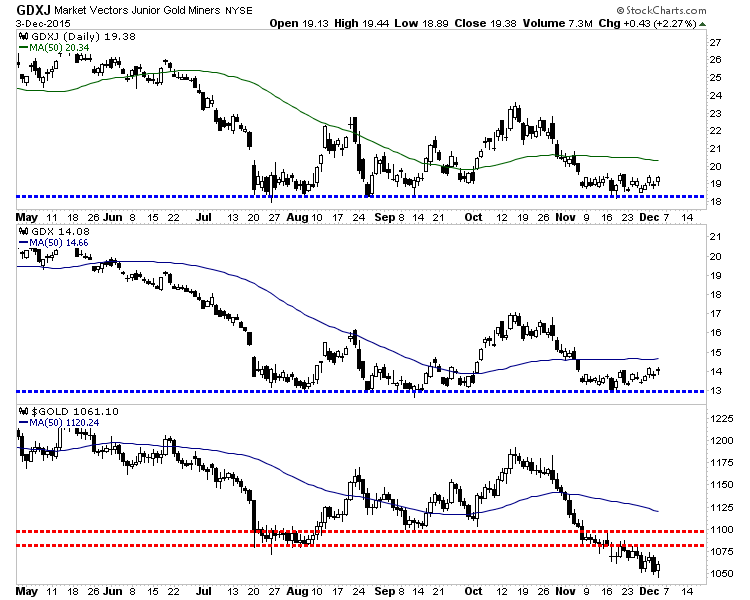
A few weeks ago we warned that the gold miners were at risk of a technical breakdown. They struggled to rebound at support while Gold was breaking to a new low. Gold continued to decline but the miners held support and stabilized. Gold traded as low as $1045 on Thursday but the miners continued to diverge in a positive fashion. The recent relative strength from the gold miners particularly in the face of new lows in Gold, coupled with the oversold condition of the metals suggests a sector rebound is developing.
The daily candle charts of GDXJ, GDX and Gold are shown in the image below. Several weeks ago Gold lost $1080 support and made a new low. The miners failed to make a new low then and continued to hold their lows as Gold grinded lower below $1080/oz. Now the miners could reach a one month high very soon while Gold could rally back to resistance at $1100/oz or slightly higher.

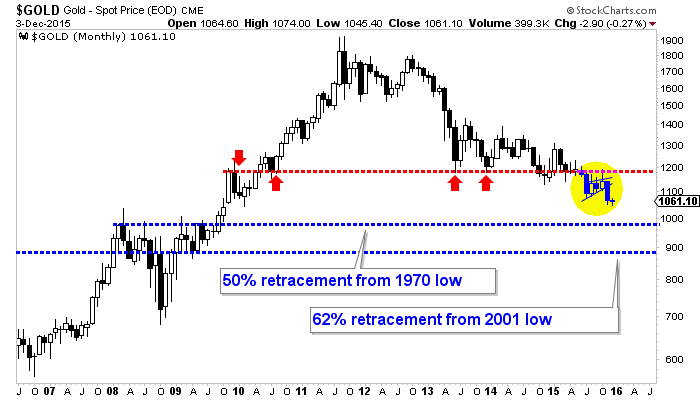
Before we continue with the miners let us comment on Gold’s outlook. Following the breakdown from the bearish flag formation Gold traded down to $1045/oz. We would anticipate Gold enjoying a bigger rebound if it first tested major support at $970/oz to $1000/oz. If Gold is beginning a rally from $1045 then it could be limited due to overhead resistance at $1100/oz to $1110/oz.

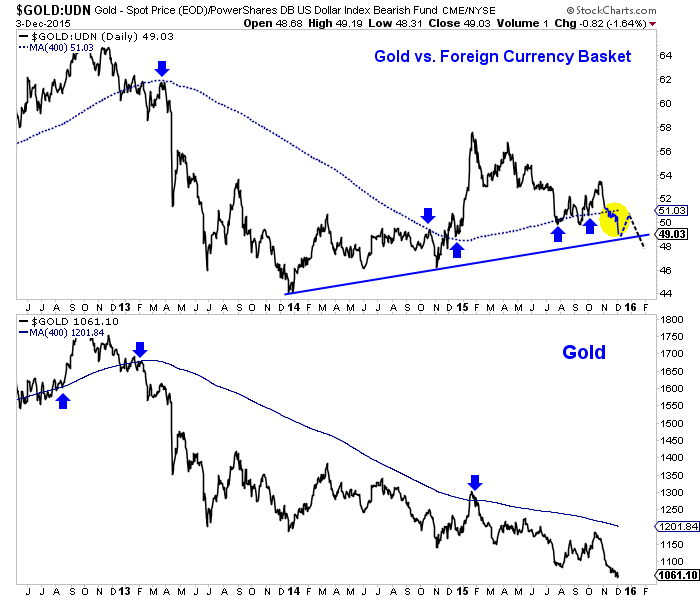
Another reason to doubt an extended rebound in Gold is its recent breakdown against foreign currencies. We plot Gold against foreign currencies (FC) and Gold in the image below. Gold/FC has been rallying for almost two years and had held above the 400-day moving average since last December. However, Gold/FC lost the 400-dma in November and continued to decline. This tells us that Gold’s recent weakness is broad based and not only a symptom of US$ strength.

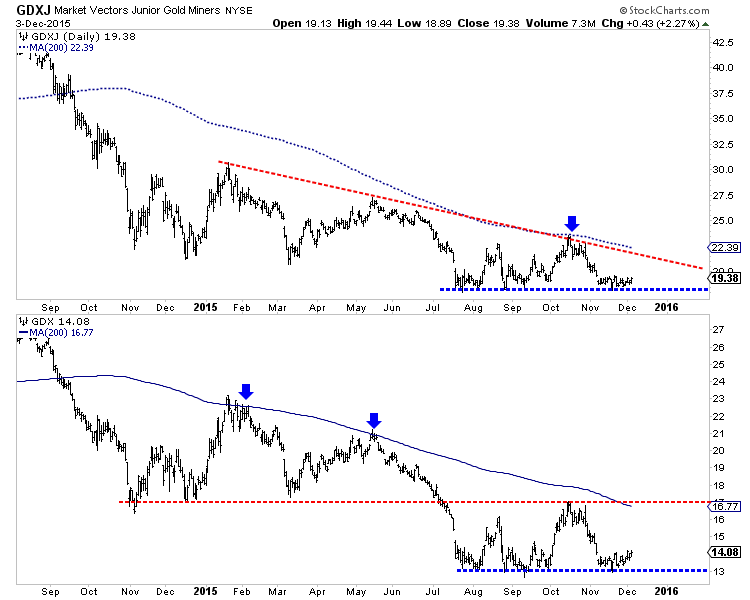
Turning back to the miners, if they continue to outperform Gold and Gold rebounds +$50/oz then they could rally to the 200-day moving averages. The daily charts of GDXJ and GDX are shown in the image below. GDX and GDXJ need to rally 19% and 15% respectively to reach their 200-day moving averages.
The fact that the gold miners held their lows even as Gold broke to new lows is bullish and hints that a short term rally is underway or could begin soon. Moving forward, we think the miners to metals relationship could be a leading indicator for the sector. Recall that the miners during the major bottom in precious metals in 2000-2001 bottomed several months before Gold. While we expect another leg lower in the metals and another push higher in the US$ index, we would not be surprised if the extremely oversold mining sector continued to diverge. As we navigate the end of this bear market, consider learning more about our premium service including our favorite junior miners which we expect to outperform into 2016.
Jordan Roy-Byrne, CMT


