Silver Market Analysis: A Deep Dive into Historic Breakout
Introduction
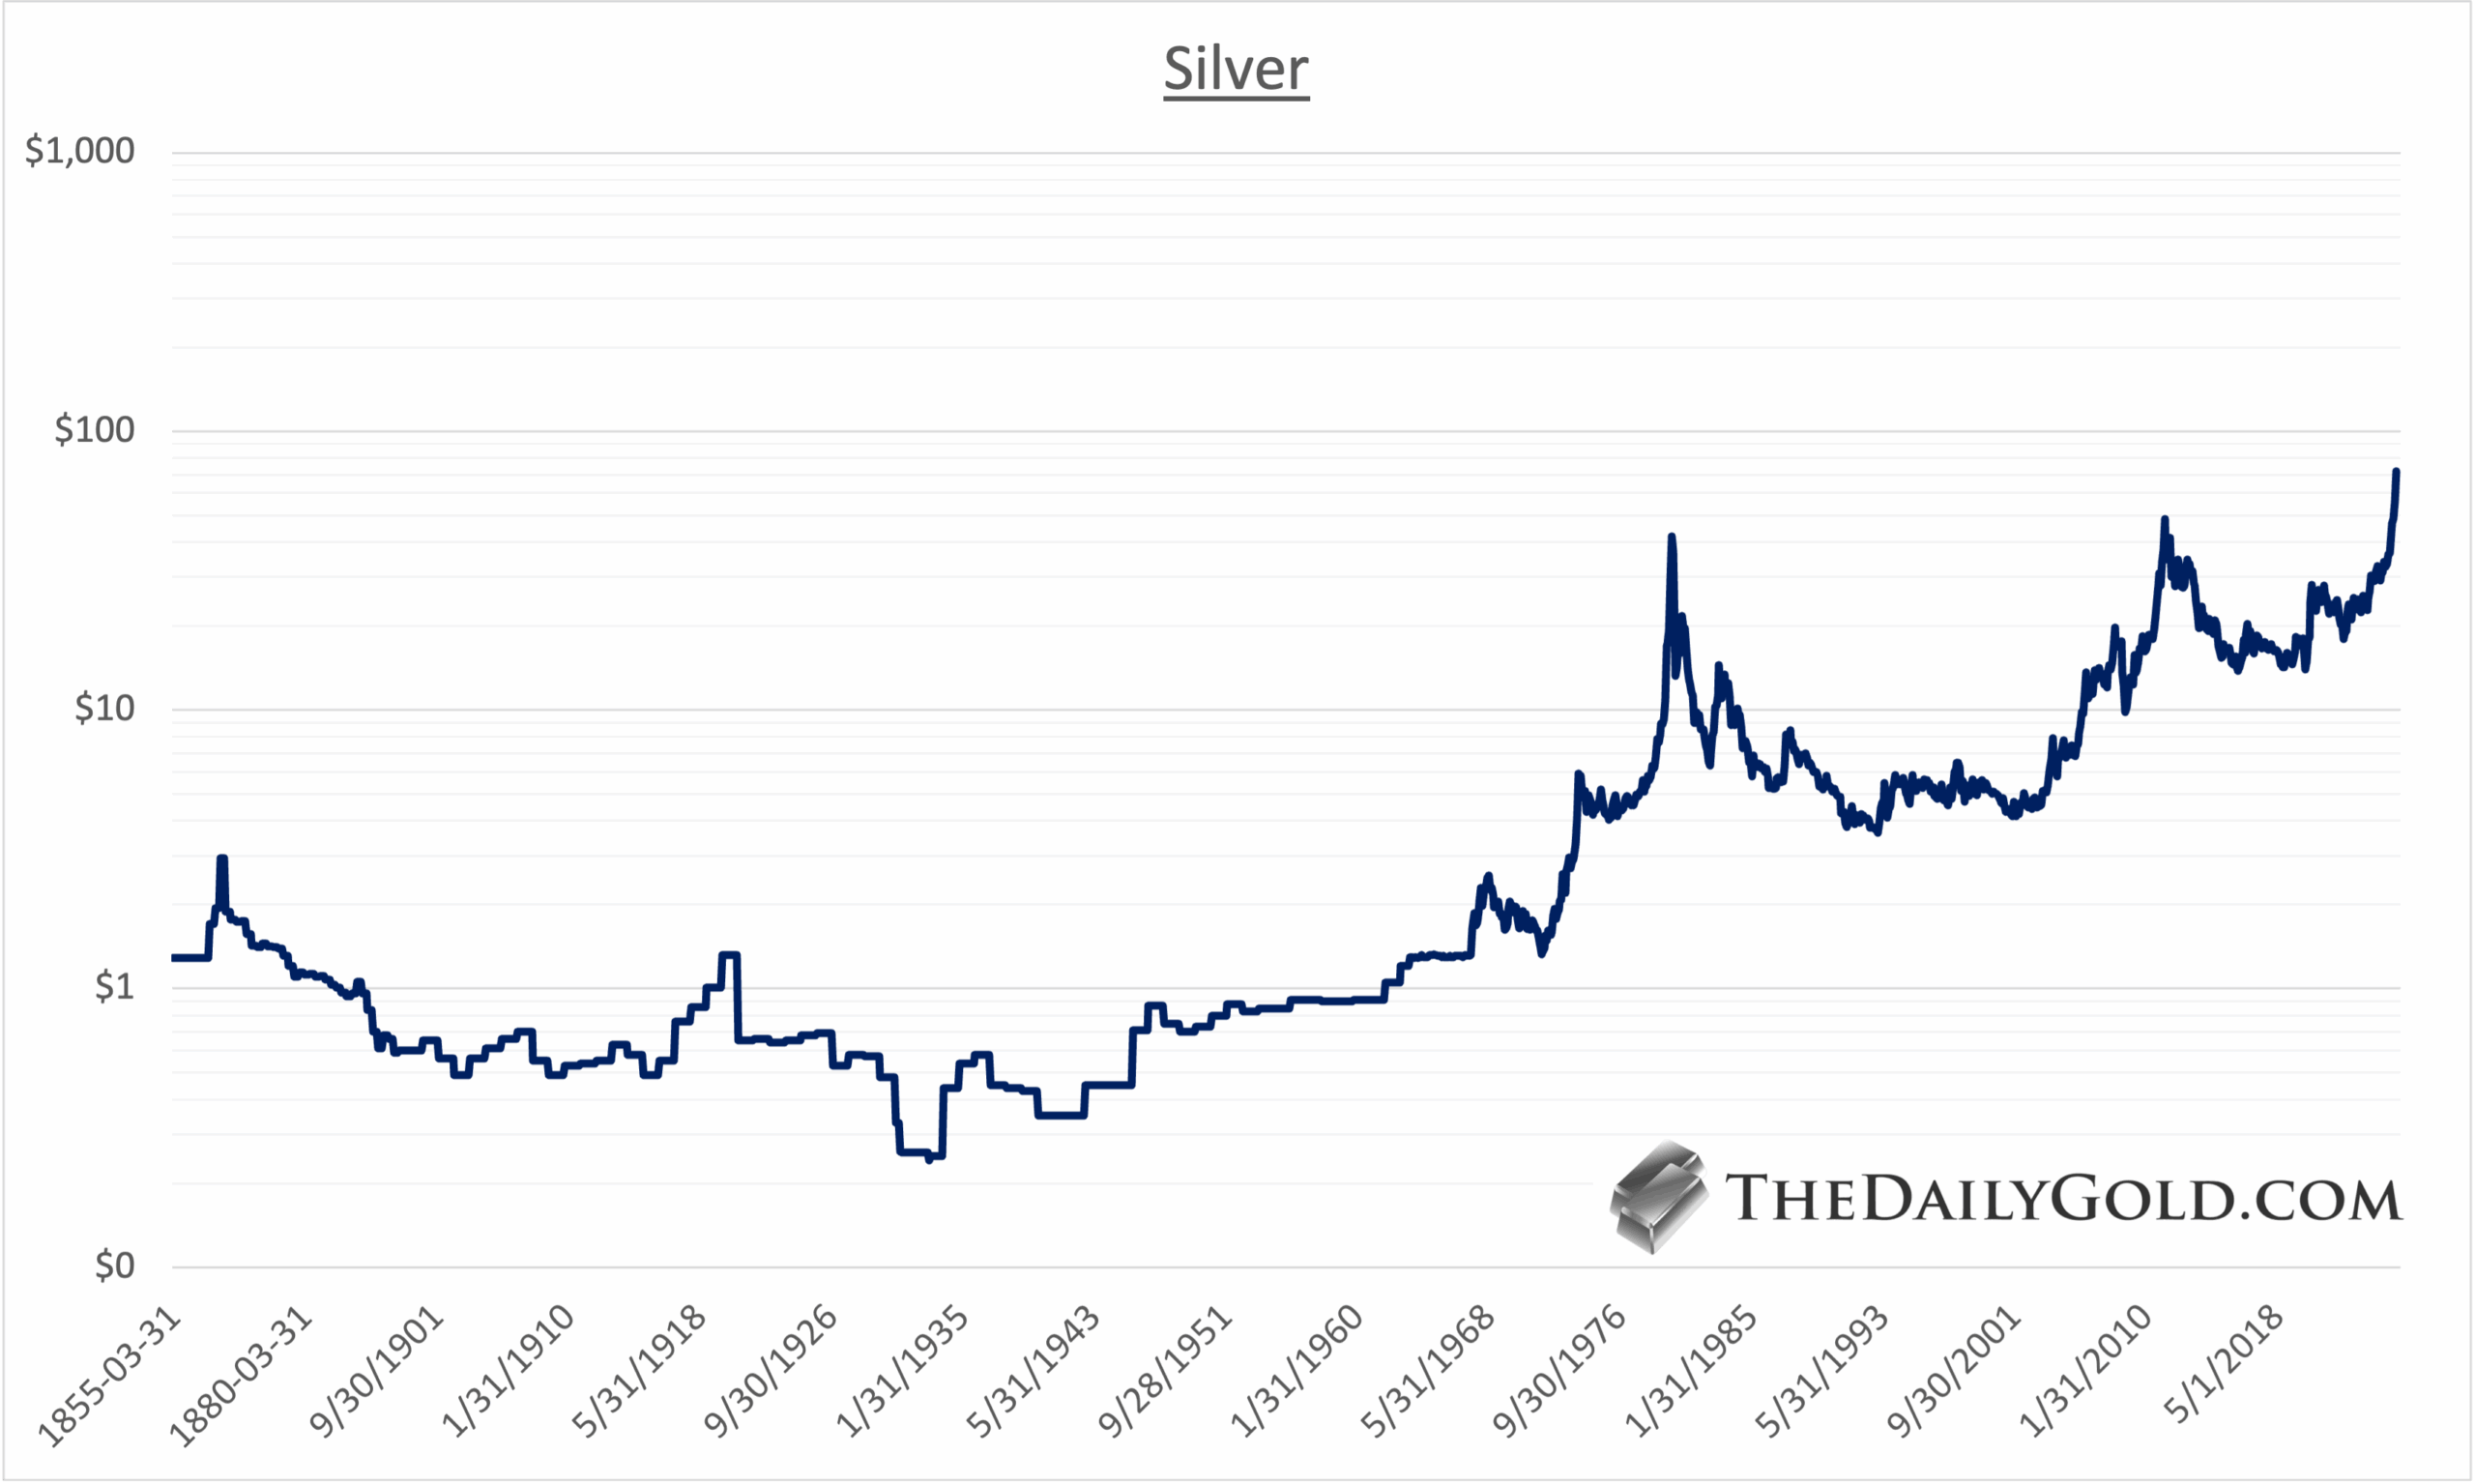
Silver has entered a historic phase in capital markets, breaking out of a 45-year consolidation base. This analysis explores the technical setup, historical analogs, and implications for silver investors, including upside targets, correction risks, and potential blowoff scenarios.
The Historic Breakout
Silver has just broken out of a 45-year-long base—the second greatest breakout in the history of capital markets. The price has closed near $72, with measured upside targets of $88 and $96. Strong support has formed around the $55 level.
This multi-decade breakout resets normal technical parameters. Historically, breakouts of this magnitude do not produce significant corrections in their early phases. Instead, they establish new trading regimes where overbought/oversold conditions are completely restructured.
Short-Term Dynamics vs. Long-Term Trend
While silver is stretched on a short-term basis, this condition is perfectly consistent with a powerful trend. A key Fibonacci objective approaches at $73/oz, which could trigger minor profit-taking.
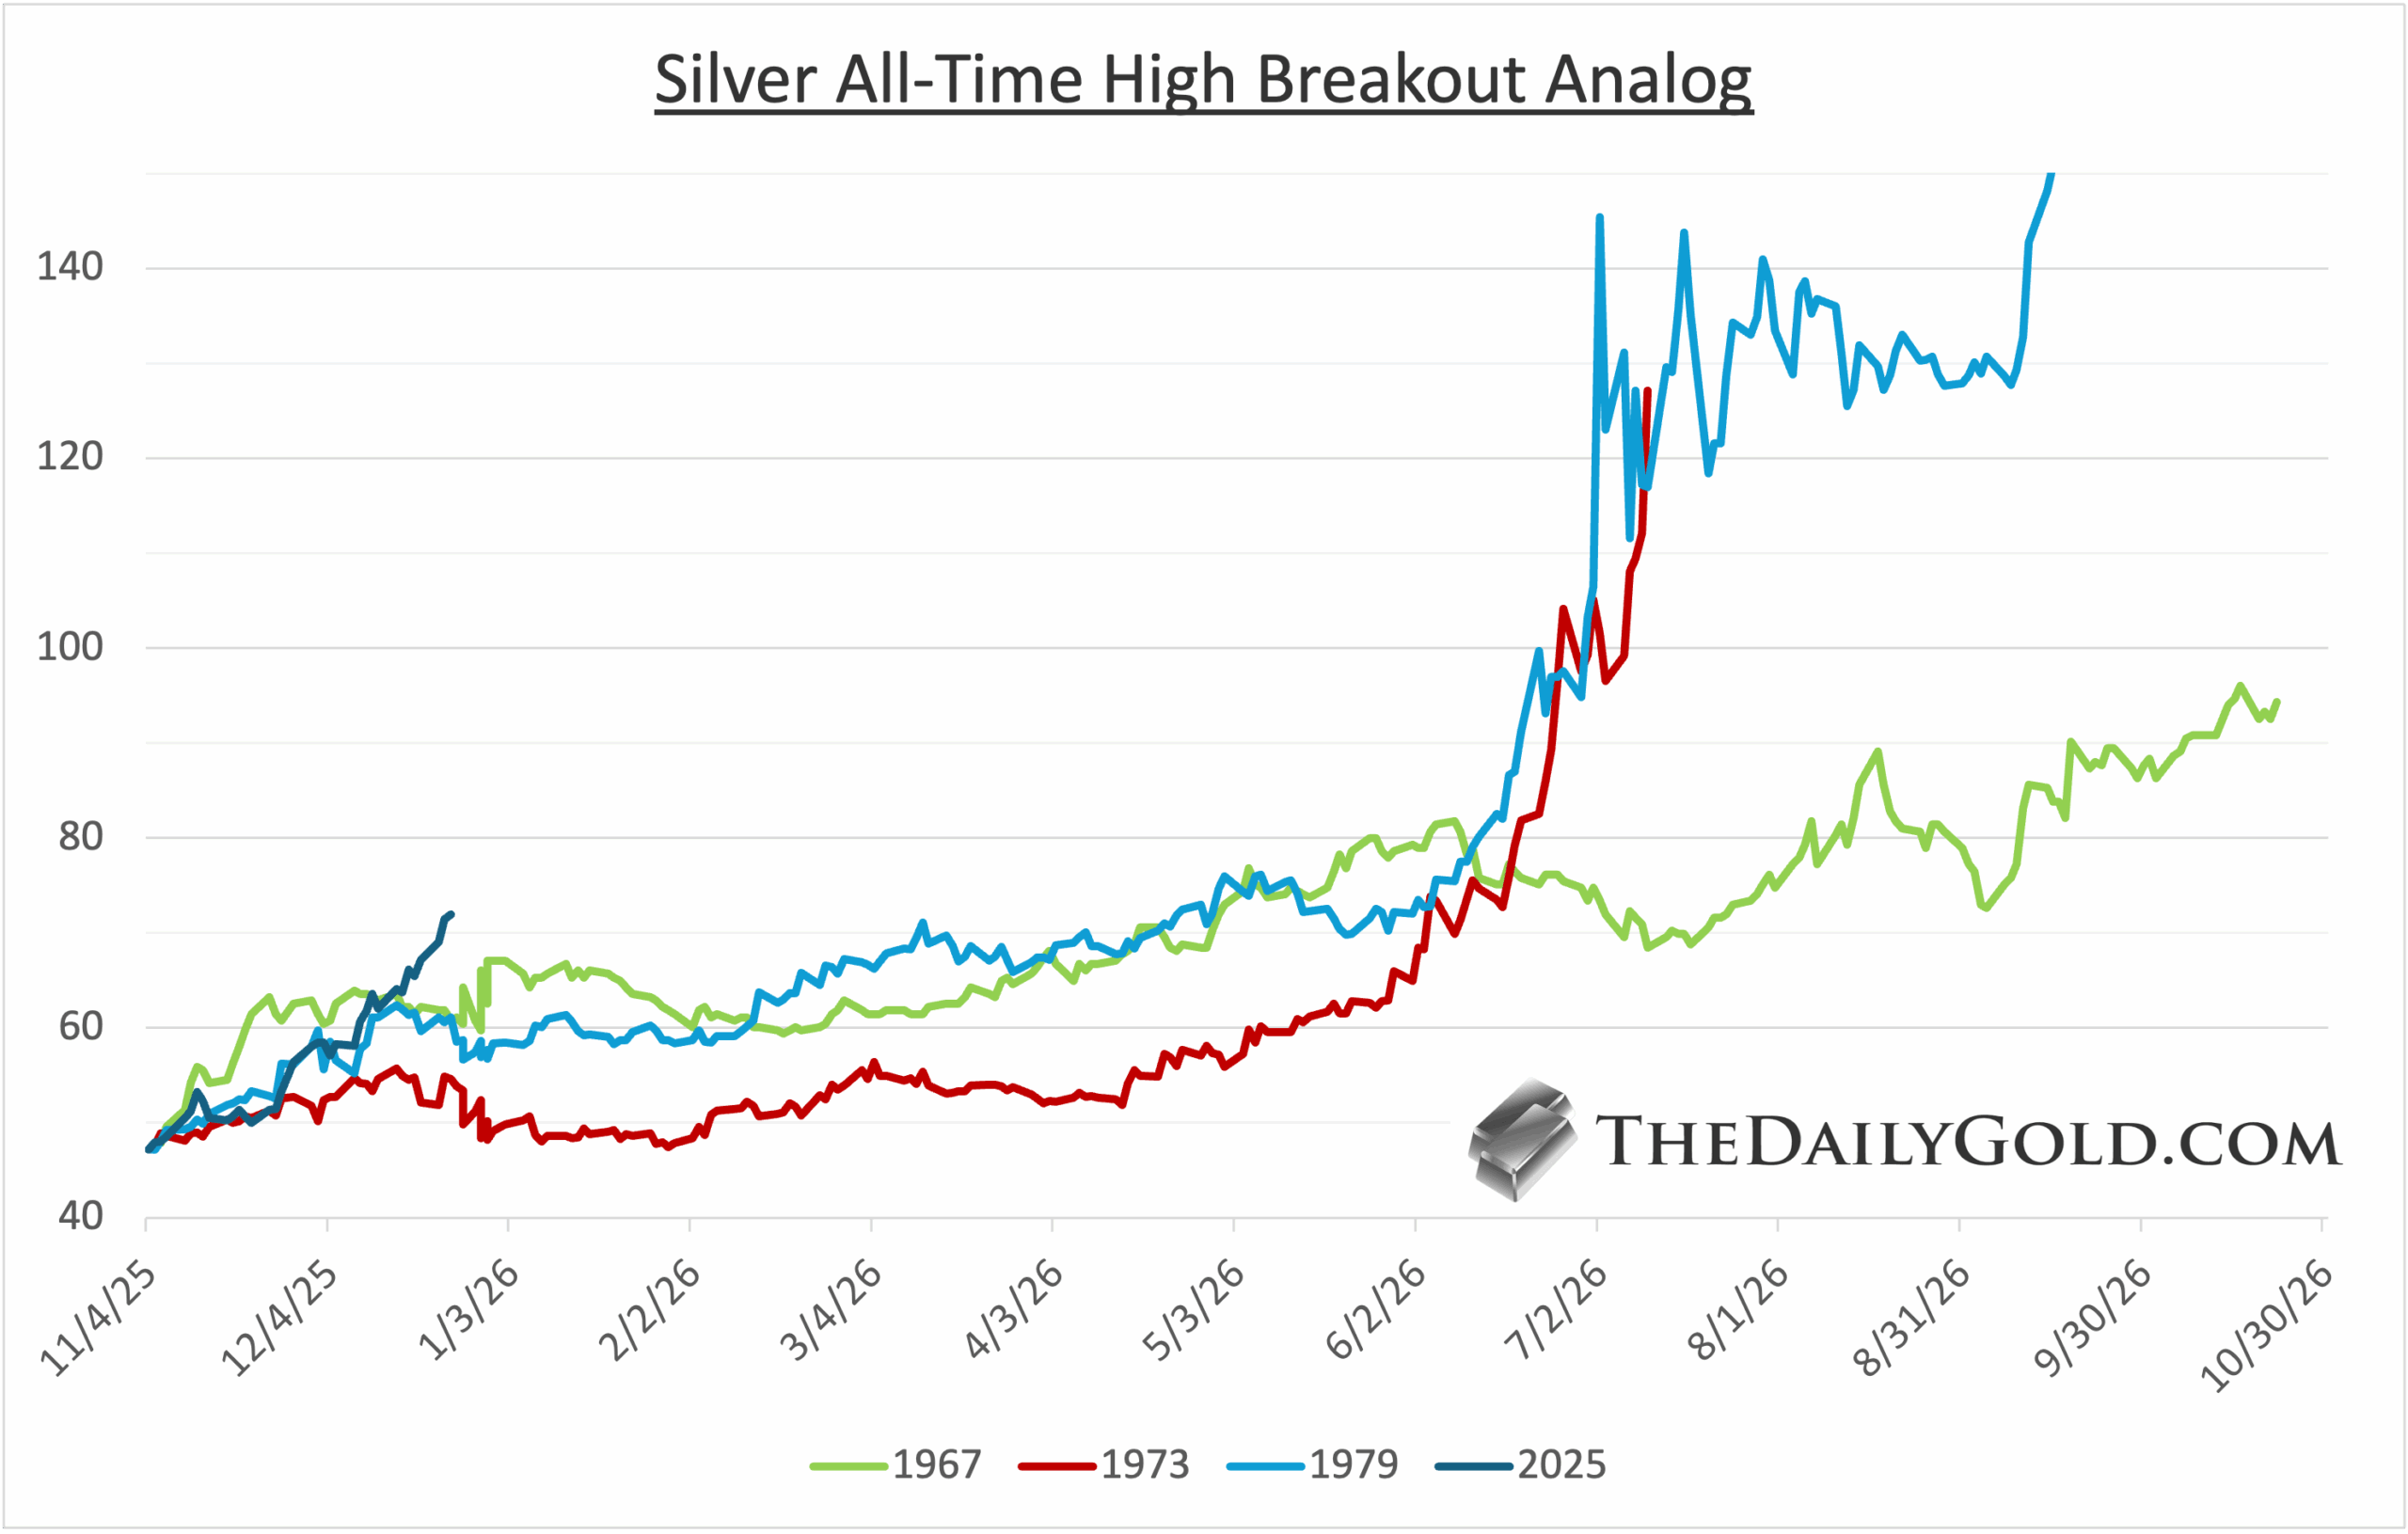
However, historical precedent is instructive. In the past three breakouts to all-time highs, silver roughly doubled over the following 7–11 months with no major drawdowns during those runs. A modest correction of $8–$10/oz is possible, but nothing of significant magnitude should be expected from current levels.
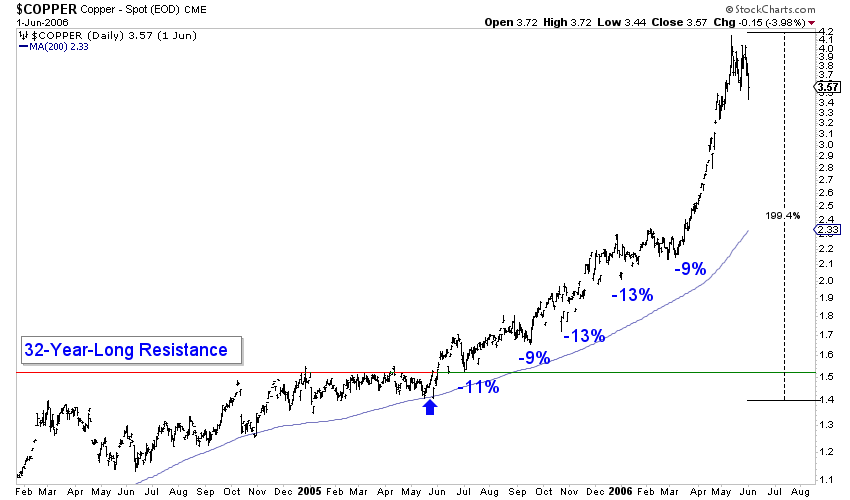
Historical Analog: The Copper Breakout of 2005
Copper provides the closest commodity comparison to silver. In 2005, copper broke out from a 33-year-long consolidation base. Following this breakout, copper gained 200% over the subsequent 12 months from its corrective low—without experiencing any significant corrections along the way. The drawdowns that occurred were minimal in closing price terms and lasted only a few days.
This precedent suggests that silver’s current trajectory may follow a similar pattern of sustained appreciation with only minor pauses for profit-taking.
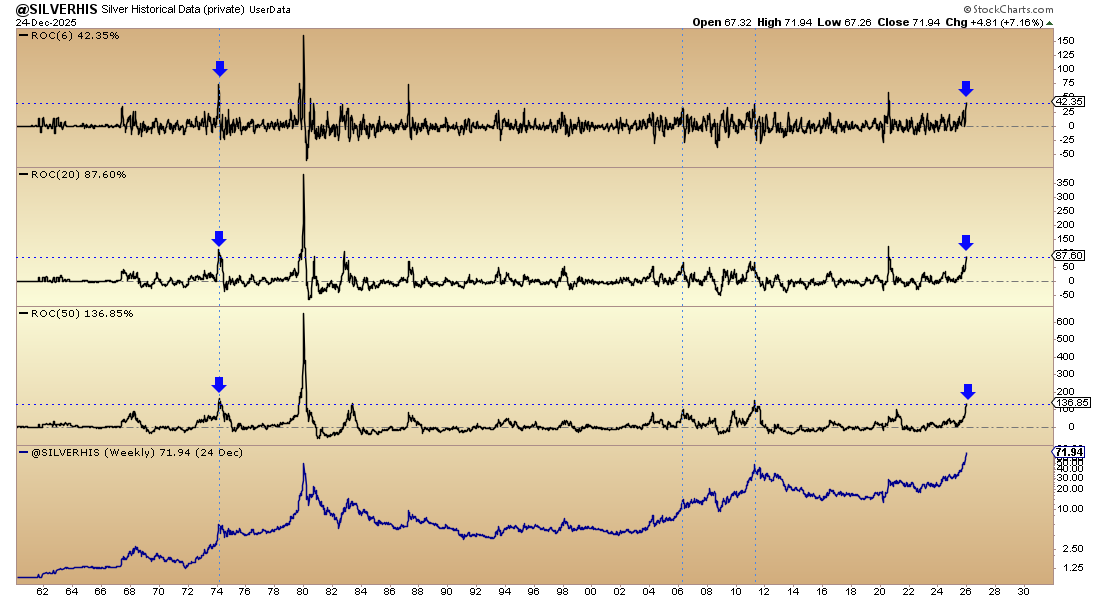
Rate of Change Analysis
Plotting silver’s rate of change (rolling performance) over the last 6, 20, and 50 weeks provides important context:
- 1979 represents an extreme outlier in historical performance
- Current silver performance is inline with historical readings, excluding 1974
- Silver has not yet reached the 1974 performance level
- Given the 45-year base breakout, we should expect these performance metrics to surpass 1974 levels
This analysis indicates that more upside remains ahead before reaching a truly extreme overbought environment.
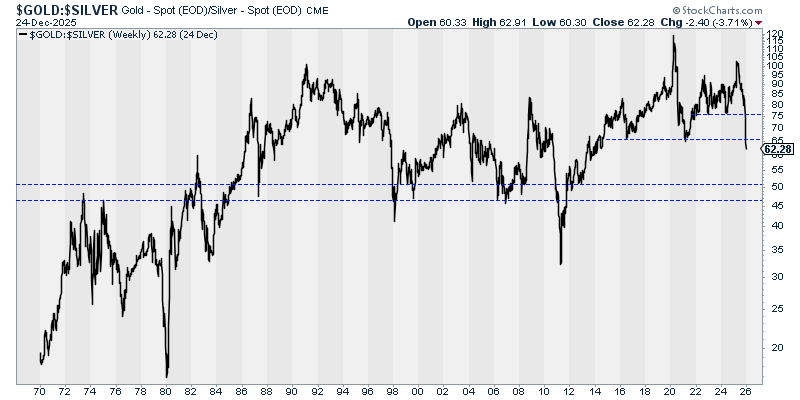
Gold-to-Silver Ratio: A Key Indicator
Silver blowoff phases typically coincide with sharp plunges in the gold-to-silver ratio. Currently, the ratio tracks at 20 and 50-week rates of change that are not yet as stretched as past extremes in 1968, 1974, 1980, 2011, and other historical peaks.
The gold-to-silver ratio recently broke below 10-year support at 65, closing at 62. To reach a true historical extreme consistent with past silver peaks, the ratio would likely need to drop further into the 45–50 zone over the months ahead. Current probabilities still favor this outcome.
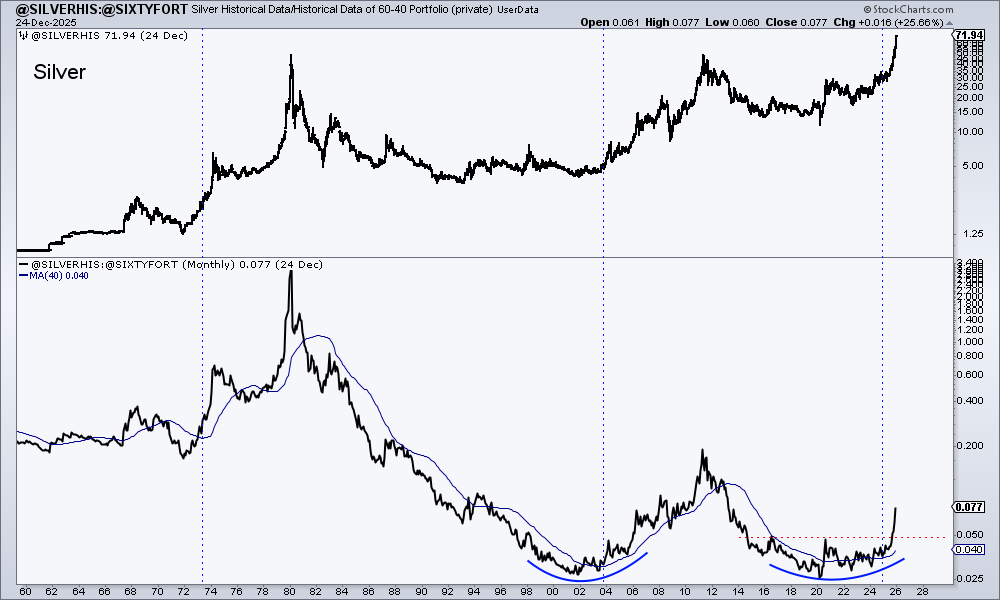
Capital Rotation: Silver vs. Traditional Assets
A critical development is silver’s breakout against the 60/40 portfolio (the traditional 60% stocks/40% bonds allocation). Silver has broken out of an 11-year consolidation base relative to this benchmark.
The weekly chart shows a perfect retest of this breakout in October, while the monthly perspective reveals the substantial room this ratio can move as it emerges from a historical double-bottom pattern. This technical setup suggests that capital is beginning to flow out of conventional assets and into silver—a significant structural shift in asset allocation.
Summary and Outlook
The Big Picture:
Silver has just broken out of a 45-year base representing the second greatest breakout in capital markets history. This type of move completely resets every technical parameter and establishes a new trading environment.
Overbought Conditions Are Not a Concern:
Silver can—and will—become more overbought than it ever was in 1974, 2011, or 2020. Gold provides a powerful precedent: after breaking out of its cup-and-handle pattern, gold doubled with no drawdown greater than 11% despite persistent “overbought” warnings. The same dynamic is likely to unfold in silver.
Price Targets:
The measured upside targets for Silver are $88 and $96. During similar historic breakouts, price has moved directly toward the equivalent of $100+ with only minor pauses along the way.
Correction Expectations:
A correction of $8–$10/oz is likely at some stage and may occur soon. However, a meaningful evaluation of major correction potential does not emerge until after silver reaches $100/oz. Prior to that level, only minor corrections should be expected.
Conclusion:
Silver’s historic breakout from a 45-year base sets the stage for sustained appreciation with minimal risk of a major correction in the near term. Capital flowing out of traditional assets into silver, combined with the gold-to-silver ratio’s potential to reach historical extremes, suggests that this precious metal remains in the early stages of a significant bull market cycle.
To learn the silver stocks (and gold stocks) we own and cover with 5x to 10x potential, consider joining our premium service.