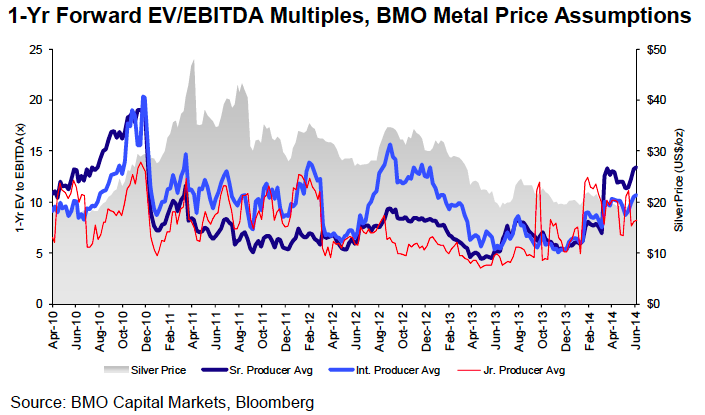
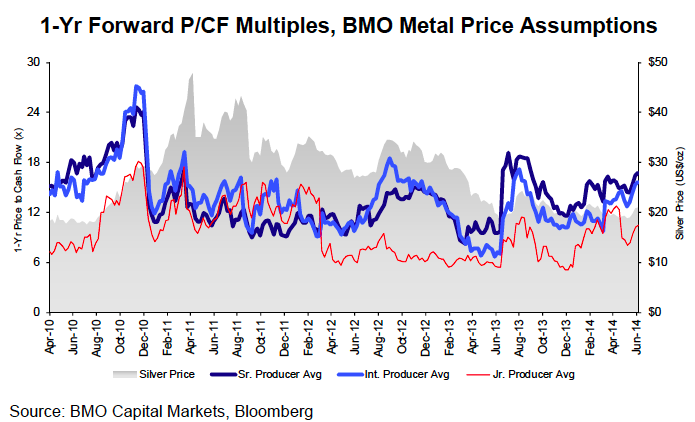
Silver Stocks Valuations (c/o BMO)
Courtesy of BMO, here are a few charts which plot valuations for silver stocks. The charts cover the last 4 years and categorize the silver stocks as seniors, intermediate and junior. The first chart is enterprise value / EBITDA. The second is price / cash flow.