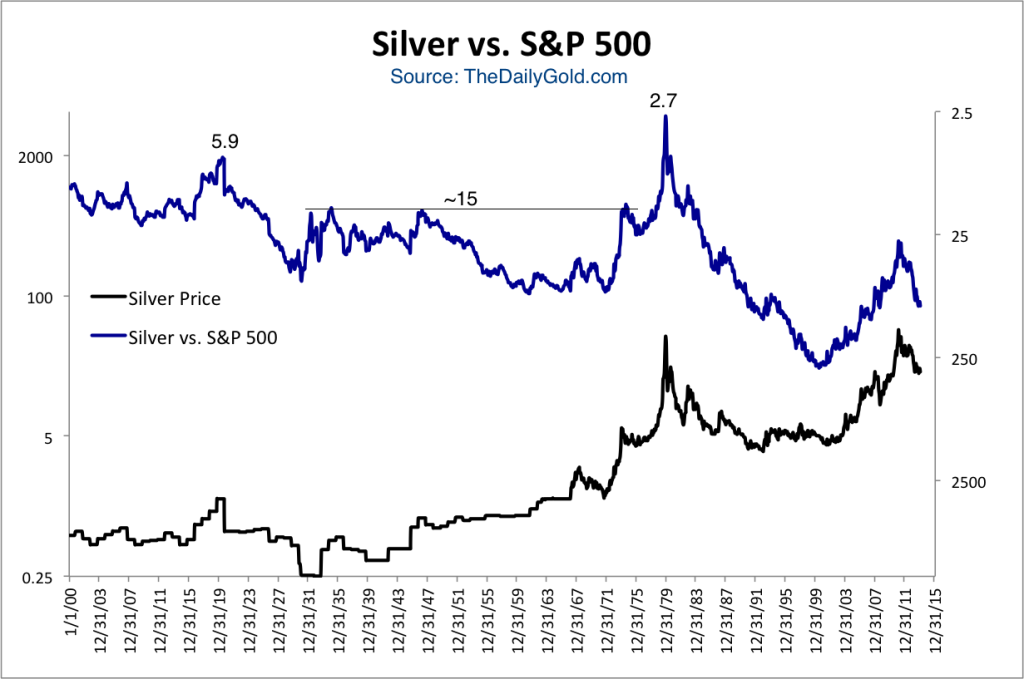
Silver vs. S&P 500 (Since 1900)
Click the image below to enlarge to full size.
The chart was composed with data from Nick Laird @ ShareLynx.com.
A few observations. The ratio peaked below 6 at the major commodity top in 1920 then remained around 15 during the Great Depression. It made its lowest peak at 2.7 during the precious metals bubble in 1980.


