Target for Silver
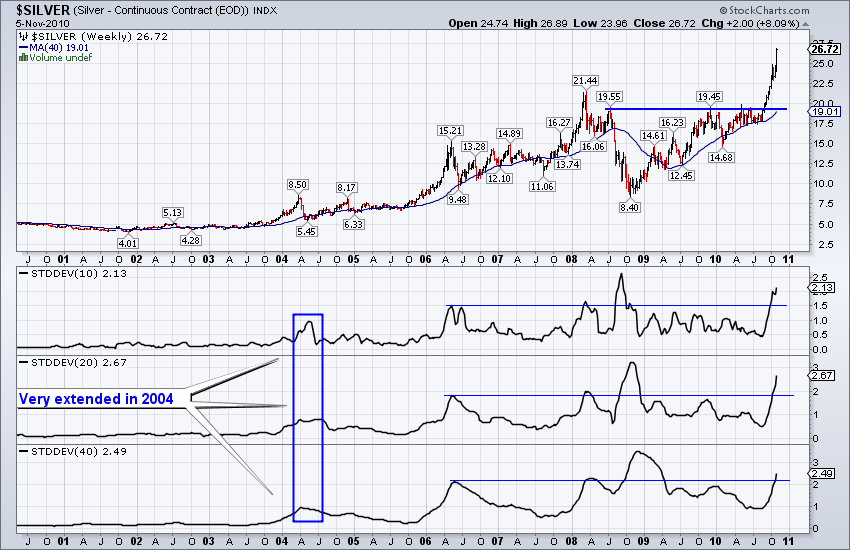
Silver has obviously had a very strong run. After breaking out past $19.50/oz, Silver has run all the way to nearly $27 with gains in eight of the past nine weeks. How much further can Silver run?
We see some confluence of targets at $32. Note that back in 1980 there was barely any trading in Silver from $25 to $33. In other words, when Silver crashed downwards, it fell quickly and then rallied back to $25. During the initial crash, it stabilized at $33. On the chart, one can see a very open space from $25 to $32.
Furthermore, $32 is roughly the 62% retracement of the major bear market from $50 down to $3. Also, if you take the difference between the resistance at $19.50 and the low at $8.40, you get nearly $31. The recent leg higher went from $18 to $25. A duplicate leg of $7 would take us to $31-$32 depending on where you start. There is quite the confluence of targets at $31-$32/oz.
In the chart below we show the standard deviations from the 10, 20 and 40 week moving averages.
The market looks quite stretched in each of those time frames. However, consider what happened in 2004. At the time, the standard deviations reached major new highs. With the market stretched right now it is important to know that there is more risk should you enter right now. At the same time, we also need to consider that the market can continue to rise before a larger correction begins. After all, it was only two months ago that Silver broke from an eight month consolidation. Odds are it will be at least a little while and probably longer, before another large consolidation or correction begins.
If you’d like more of this kind of analysis and professional guidance in your trading and investing throughout this precious metals bull market, then consider a free 14-day trial to our service.
Good Luck!


