The Inflation Mega-Trend Continues With UK CPI 3.4%, RPI 5.1%
 Another month and another release of UK inflation data at far above the Bank of England’s target of 2% and above the upper limit of the Banks 1% to 3% range by reporting CPI of +3.4% for May. Thus the BoE Governor, Mervyn King will write another letter to repeat that the high rate of inflation is just “temporary”, though when does “temporary” high inflation stop being temporary? 6 months? a year? 2 years? as the country sleep walks into stagflation with all of the consequences for wage earners and savers.
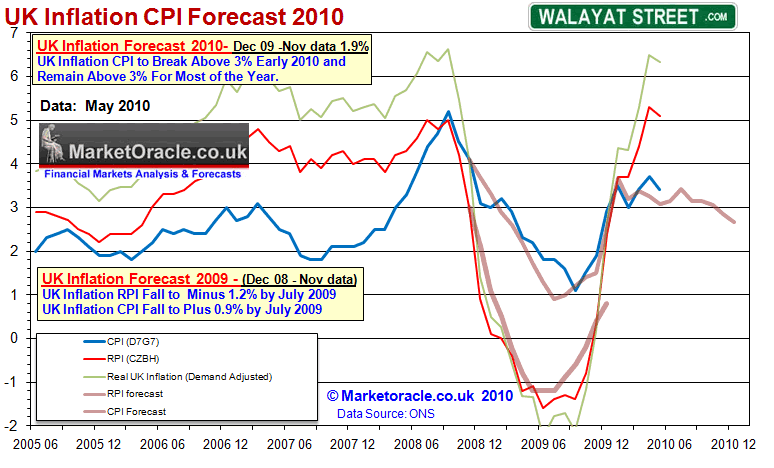
Meanwhile the real rate of UK inflation as measured by the publically more recognised RPI index remains even higher at 5.1%, which after stripping out the effects of manipulated low interest rates as a consequence of Quantitative Easing and other direct interventions to support the Housing Market such as the funneling of tax payer cash onto bailed out banks balance sheets leaves the RPIX also at 5.1% which better reflects actual UK consumer price inflation experience and is set against my own real UK inflation tracker that stands at 6.3%.
UK Inflation Forecast 2010
UK Inflation of CPI at 3.4% for May is remarkably close to my trend forecast for 2010 as of December 2009 that projected May data of 3.1%. My analysis since November has been warning of a spike in UK inflation as part of an anticipated inflation mega-trend (18 Nov 2009 – Deflationists Are WRONG, Prepare for the INFLATION Mega-Trend ) that culminated in the forecast of 27th December 2009 (UK CPI Inflation Forecast 2010, Imminent and Sustained Spike Above 3%) and the Inflation Mega-trend Ebook of January 2010 (FREE DOWNLOAD) as illustrated by the below graph.
 Bank of England’s Worthless Inflation Forecasts
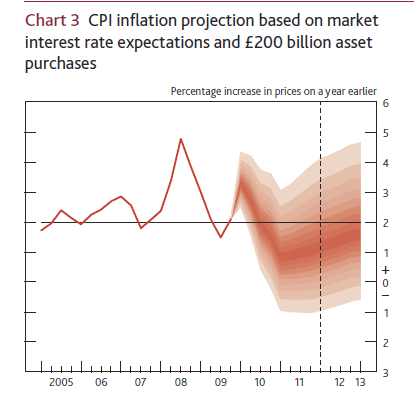
According to the Bank of England’s forecast for UK inflation of just over a year ago (Feb 2009) – May 2010 CPI Inflation should by now be at 0.9%, instead of the actual rate of 3.4%. Whilst the more recent Bank of England Inflation Report (Feb 2010) of barely 4 months ago forecast that UK inflation by May should have fallen to about 2.3%, instead it is at 3.4% (see graph).
Therefore how credible are the Bank of England’s persistent claims that the ongoing rise in UK inflation is “temporary” and that it is forecast to fall to UNDER 1% by the end of 2010 (Feb 2010) ?
The Bank of England has a track record of being wrong 96% of the time in its inflation forecasts of where inflation will actually be in 2 years time, as the usual mantra is for UK inflation to magically converge to 2% in 2 years time, much as the graph on the right concludes towards.
VAT 20% Inflation Surge Time Bomb
Whilst the trend in UK CPI continues inline with expectations however the New Con-Dem government is expected to detonate the VAT Hike inflationary Bomb that will likely result in an surge higher in Inflation to above 4% CPI and 6% RPI following next weeks emergency budget on 22nd June 2010, as I wrote of during the election campaign (05 May 2010 – Greece Economic Depression Resulting in INFLATION NOT DEFLATION Surge )
A post UK election VAT hike to 20% from 17.5% is near certain to bring in extra revenue of about £13 billion per year. This will have the effect of both spiking inflation sharply higher and maintaining the ongoing longer-term inflationary mega-trend, therefore I would not be surprised that following the implementation of a VAT tax hike that CPI spikes above 4% and RPI as high as 6%! Which would further discredit the Bank of England’s mantra of “Don’t Worry Folks its Only Temporary”.
I wonder how many ordinary UK citizens will believe the Bank of England’s statements of temporary inflation when they see Inflation of CPI 4%+ and RPI 6% following the VAT hike. Will they still be willing to accept wage hikes of 2% or less, or will they start to demand ever higher wage rises to match surging inflation and hence feed the the wage price spiral.
Therefore my growing expectations are for the actual trend in UK inflation to continue to materialise to the upside of the forecast for 2010, with a continuation of high UK inflationary trend well into 2011, with an in depth forecast for 2011 to follow before the end of 2010.
Inflation Is a Government Stealth Tax On / Theft From Savers and Workers
Whilst Mervyn King writes another letter full of repetitive excuses as to why the Bank of England cannot do its job. The price is being paid for by ordinary savers and workers who are in effect being robbed by the banks and the government as inflation is a stealth tax on savers and earners that seeks to stealthily destroy the real value of accumulated life time savings and erode the real purchasing power of earnings.
Add to this that savings are TAXED at 20% then savers should be enraged and demonstrating in the streets as to why they are receiving a pittance of interest rates at just 2% on even the top ranked savings accounts when inflation as measured by RPI is at 5.1%, and when tax is taken into account savings interest rates would need to be at 6.1% JUST to break even against inflation. So basically the Government, Bank of England in collusion with the bankster’s are STEALING more than 60% of the earnings capacity of savings and therefore theft of the real capital value.
Readers don’t be under any illusion, the Bank of England has lost control of inflation as the normal response to high inflation is to raise interest rates, instead of a UK base rate of 0.5% it should be at 4.5%. The reason why rates remain at 0.5% is as part of the process of transferring bankrupt bank debts off the bank balance sheets and onto the tax payers, that’s you the tax payer who is picking up the tab by taking on the liabilities and debts of the bankrupt banking sector, which STILL more or less remains BANKRUPT, that only survives as a consequence of government support by means printing money and keeping interest rates at 0.5%. This means that savers and wage earners are being forced to a. subsidise the bankrupt banking sector and b. finance the governments budget deficit and total growing debt mountain by means of the stealth tax called INFLATION, which seeks to eat away the value of the total debt, as elaborated at length in the Inflation Mega-Trend Ebook (FREE DOWNLOAD)
The Deflationary Pseudo Economists
If you read much of the mainstream press that tends to buy the Bank of England’s monthly litany of excuses, you may get the impression that there is a tug of war going on between inflation and deflation, with the outcome yet to be decided. This despite the fact that CPI inflation is at 3.4% and RPI at 5.1%, i.e. some distance from zero.
The reality of the situation remains in that the worlds economies swim in an ocean of inflation with the occasional ripples of deflation on its surface, as the following graphs illustrate that the pseudo economists with their persistence deflation clearly only see the deflationary ripples whilst missing the deep inflationary ocean.
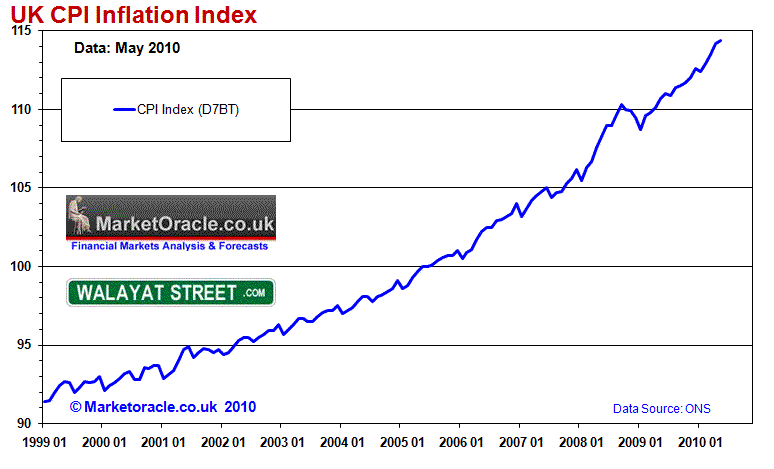
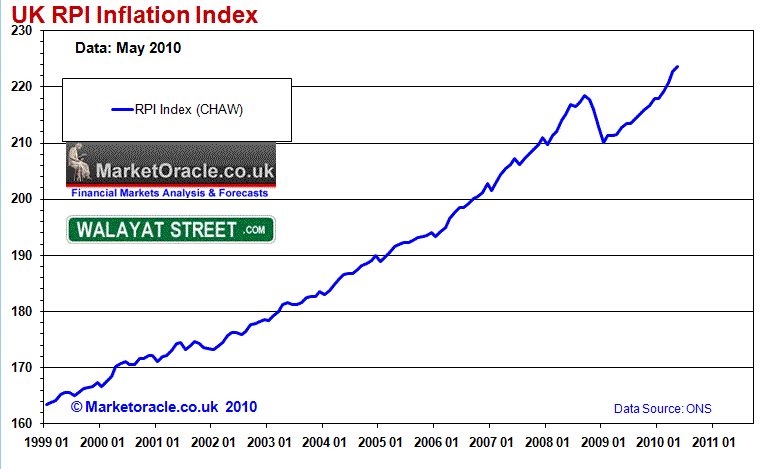
The above CPI and RPI Index graphs clearly show there IS NO DEFLATION! As Deflation in our money printing fiat currency bankster run fraudulent financial system can only exist fleetingly as a mere ripple on the surface that is utilised by the vested interests in the Inflation Mega-trend to ensure further inflationary money printing policies are always enacted by governments so as to STEALTHLY Steal the wealth and earnings purchasing power of ordinary people who are gradually FORCED into becoming debt slaves in an attempt to maintain falling standards of living.
Protect Your Savings and Wealth
The Inflation Mega-Trend Ebook (FREE DOWNLOAD) covers at length the whole on going theft of value of savings and wage purchasing power, but more importantly contains 50 pages of what people can do to protect their wealth.
If you keep your money in the bank or building society then you are letting the bankster’s gradually steal the value of your savings as the rate of return to beat CPI inflation and the 20% savings tax will need to be about 4.3%, instead the banking sector typically offers depositors less than 2% for instant access accounts and less than 2.75% for 1 year fixes. The easiest and safest way for investors to protect themselves immediately is ironically a government backed product, the National Savings Index Linked certificates that pay 1%+ RPI Inflation that’s 1% Plus 5.1% if inflation remains at 5.1% for the next 12 months. The actual formula is based on the RPI indices at anniversary against where it stood at the time of Purchase.
More advanced mechanisms for protecting your wealth such as investing in safe big cap cap dividend paying stocks, commodities such as oil and gold and silver and wheat which is particularly cheap at the moment, and other fiat currencies that are expected to appreciate in the long-run such as the Chinese Yuan, Aussie Dollar are covered at length in the Inflation Mega-Trend Ebook.
Bottom Line – You NEED to protect your wealth from the government and the Bank of England that will seek to steal the value of your wealth and earnings by means of INFLATION. The government has no choice but to print money and monetize debt, it HAS NO CHOICE. There is no other way out, yes there will be the occasional deflationary ripples but the worlds economies swim in an ocean of inflation as evidenced by the RPI and CPI Inflation indices which ensure the Inflation Mega-Trend will run not for months, or even years but decades!
UK Interest Rates , Spending Cuts and Economic Growth
The Bank of England has so far FAILED to respond to high inflation by starting to raise interest rates, clearly the Bank of England is delaying any action on rates ahead of Government spending cuts and tax rises to total about £60 billion a year to be announced in a weeks time (though the government has tied one arm behind its back by ring fencing Britians sacred spending cow, the NHS). Therefore it is a case of the Bank of England hoping that inflation will not rocket higher. However in my opinion delaying interest rate hikes in the face of high inflation will result in even higher inflation and thus eventually even higher interest rates when the country reaches a crunch point that the market will force the governments hand by pushing bond prices significantly lower much as many European countries are experiencing.
The only element missing from the equation so far is economic growth which I expect to surprise to the upside this year, whilst growth is yet to materialise in any official data it is however showing itself in higher tax revenues and thus a smaller budget deficit which is now more than £20 billion LESS than forecast barely 3 months ago. So as strong growth materialises we will start to see the focus at the Bank of England’s monthly MPC meetings gradually shift from being uber dovish on interest rates to issuing hawkish statements to eventually near panic hawks as interest rates are sent sharply higher in a belated move to prevent sharply higher inflation from materialising. So at the end of the day UK growth and interest rates will be significantly higher a year from now, which will leave most of the pseudo / academic economists with egg on their face as they continue with the mantra of no or very little change in UK interest rates for several years.
Existing Forecasts :
UK Interest Rates Forecast 2010-11: UK interest Rates to Start Rising From Mid 2010 and Continue into end of 2010 to Target 1.75% / 2%, Continue Higher into Mid 2011 to Target 3%. (UK Interest Rate Forecast 2010 and 2011 )
UK Strong Economic Recovery 2010 +2.8%, Q1 2011 peak of +3.4% (year on year), 2011 End +2.3%. NO Double Dip Recession, NO Negative Quarters for 2010 or 2011.(31 Dec 2009 – UK Economy GDP Growth Forecast 2010 and 2011, The Stealth Election Boom )
UK House Price Inflation
High inflation also has implications for important asset classes such as the UK housing market as persistently high inflation will tend to support nominal prices whilst prices in real terms continue to stagnate. I will be preparing an in-depth analysis (free ebook) over the next 6-8 weeks to conclude towards a UK house price trend forecast for the next 2-3 years, that will seek to more than replicate the original 2 year bear market forecast of August 2007 made right at the very peak of the UK housing market (22 Aug 2007 – UK Housing Market Crash of 2007 – 2008 and Steps to Protect Your Wealth ), and which builds up on the 100 page Inflation Mega-Trend Ebook of Jan 2010 (Free Download Now), which contained the following UK housing market analysis (graph updated):
UK Housing Bear Market Election Bounce
The UK housing market peaked in August 2007 and entered into a 2 year bear market exactly as forecast at the time (22 Aug 2007 – UK Housing Market Crash of 2007 – 2008 and Steps to Protect Your Wealth ), analysis which projected towards a fall in UK house prices from August 2007 to August 2009 of between 15% and 25% that has subsequently came to pass as UK house prices bottomed in March 2009 after having fallen by 23% from the 2007 peak.
The UK housing bear market has experienced a strong bounce off of the March 2009 lows and now stands up approx 10% off of the low as a consequence of unprecedented measures as mentioned in this ebook, the Labour government has succeeded in temporarily bringing UK house price falls to a halt and triggering an Election Bounce.
The impact of the inflation mega-trend on the UK housing market will be for UK house price to be supported in nominal terms, however this it does NOT ignite the feel good factor that triggers housing market booms which only follow when house prices begin to significantly rise in REAL terms i.e. after inflation.
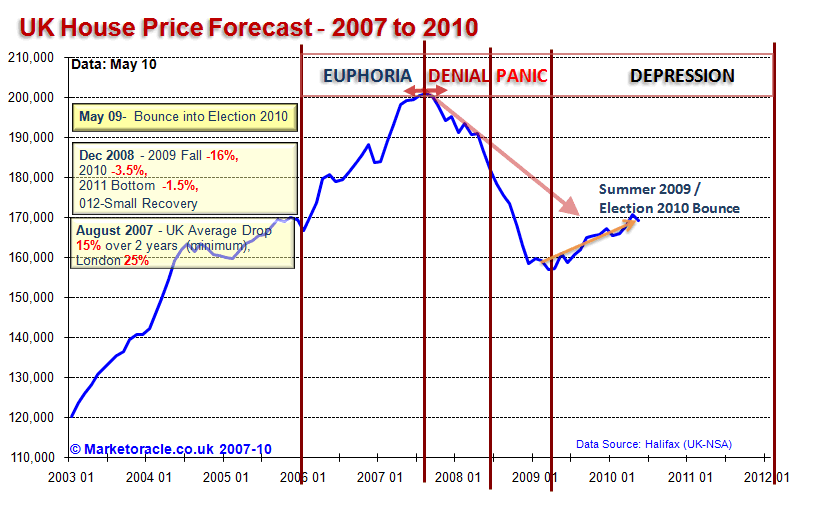
Whilst the current corrective bounce looks set continue into the middle of 2010 (allowing for a potential one month blip as a consequence of the bad January weather), this rally is still seen as a correction within a housing bear market that is expected to remain in a depression for many years, before house prices succumb to the effect of the inflation mega-trend and start to rise.
U.S. Deflation?
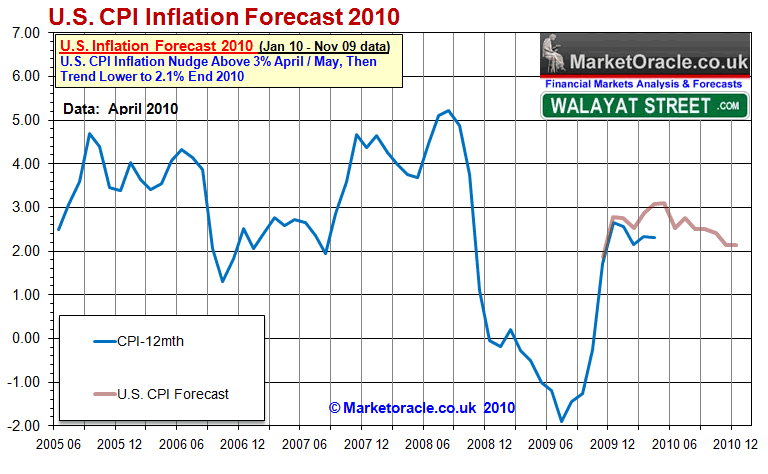
The illusion of deflation continues even more vocally in the United States mainstream media and BlogosFear, much as the mantra of the always imminent return of the stocks bear market at the end of every correction continues. Again the facts don’t support the rhetoric as U.S. CPI continues to rise by more than 2% per annum instead of being negative by now as Deflationists were loudly proclaiming barely 6 months ago. Instead persistent perma deflationists conjure deflationary rabbits out of the hat such as the Gold divided by X ratio to imply deflation exists, anything other than refer to the the actual RISING inflation indices. Off course were U.S. CPI negative by now then the perma deflationists would be crowing loudly.
As things stand U.S. CPI inflation is trending below the forecast path (Inflation Mega-trend Ebook), which is not so surprising given the strength of the U.S. Dollar during 2010. The weaker inflationary trend therefore projects towards a year end inflation rate of between 1% to 1.25% against the original forecast of 2.1%, which is still a far cry from outright deflation as seen during 2009.
Stock Market Trending Inline With Expectations
The stock market continues to trend inline with the last in depth analysis (16 May 2010 – Stocks Bull Market Hits Eurozone Debt Crisis Brick Wall, Forecast Into July 2010), with most recent price action seeing the Dow break out of its tightening range of between 10,300 and 9,800 which targets a trend to Dow 10,700+. The trend of the past 3 weeks has been accumulating ever louder bearish commentary and sentiment with the Perma crowd announcing with near certainty that April was the TOP !, Just as Jan 10 was before it, and Oct 09 before that and August 09 before that and April 09 before that. Overall expectations remain for the Dow to be stuck within a volatile upwards trend into Mid July 2010, as illustrated below.
Stock Market Conclusion
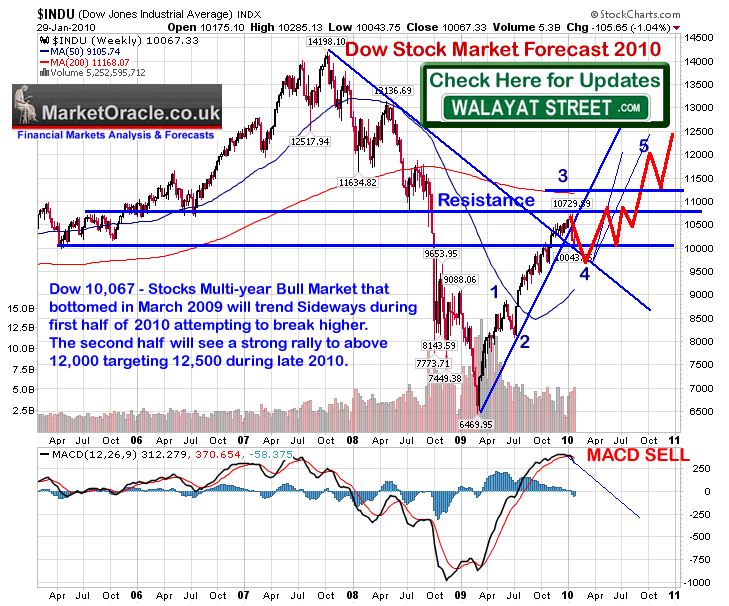
Despite the flash in the pan crash and prevailing Eurozone sovereign debt default gloom and doom, the bottom line is that this is still a stocks bull market with the Dow ONLY down less than 6% from its bull market peak. Therefore the sum of the above analysis concludes towards the stocks bull market under going its most significant and a highly volatile correction since its birth in March 2009 (15 Mar 2009 – Stealth Bull Market Follows Stocks Bear Market Bottom at Dow 6,470 ). This correction could last for several months and may extend all the way into early October, which suggests that the next 2 months are going to see an ABC correction to be followed by a sideways price action between the extremes of 10,900 to 9,800 and so despite continuing wild gyrations I would not be surprised if the Dow is little changed from its last closing price of 10,620 in 2 months time (16th July 2010). Expectations remain for the bull market to resume its trend towards a target of between 12k to 12.5k by late 2010 after the tumultuous trading period over the next few weeks. I have tried to illustrate a more precise Dow forecast projection in the below graph, reality will probably end up being far more volatile.
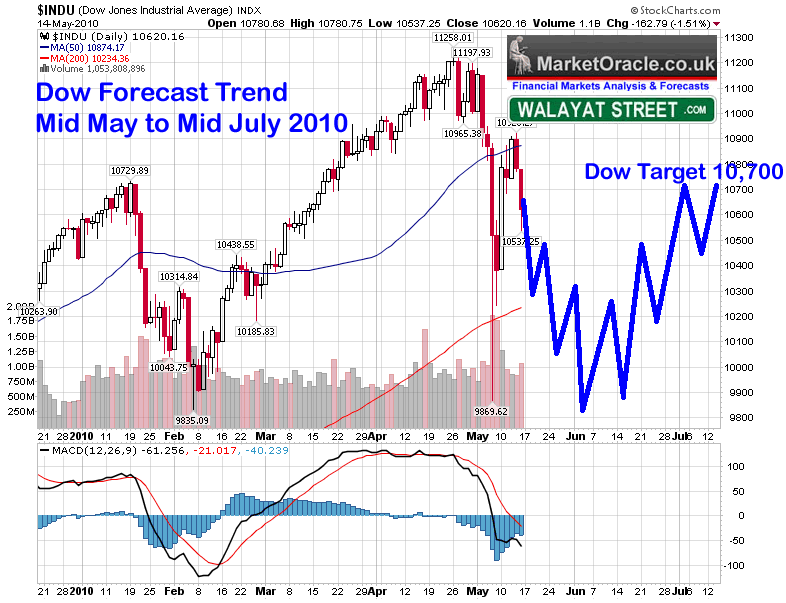
To date the correction has not done ANYTHING to suggest that it is anything other than correcting the preceding 13 month bull run, in fact in trend terms it is pretty close to the forecast run for the year as indicated by the below graph of the even BIGGER Picture from the Inflation Mega-trend Ebook over 4 months ago (FREE DOWNLOAD).
You know you’ve seen the bottom when you see Dr Doom Nouriel Roubini and PIMPCO Bond Pumper Mohammed El-Erian on CNBC, and if you see them both at the same time ? BUY, BUY, BUY !!!
Your inflation mega-trend stocks bull market investing analyst.
Comments and Source: http://www.marketoracle.co.uk/Article20334.html
By Nadeem Walayat
Copyright © 2005-10 Marketoracle.co.uk (Market Oracle Ltd). All rights reserved.
 Nadeem Walayat has over 20 years experience of trading derivatives, portfolio management and analysing the financial markets, including one of few who both anticipated and Beat the 1987 Crash. Nadeem’s forward looking analysis specialises on UK inflation, economy, interest rates and the housing market and he is the author of the NEW Inflation Mega-Trend ebook that can be downloaded for Free. Nadeem is the Editor of The Market Oracle, a FREE Daily Financial Markets Analysis & Forecasting online publication. We present in-depth analysis from over 500 experienced analysts on a range of views of the probable direction of the financial markets. Thus enabling our readers to arrive at an informed opinion on future market direction. http://www.marketoracle.co.uk

