The Next Breakout Charts in Gold & Silver

Gold has broken out from a super bullish cup and handle pattern. This breakout is historically significant as it has tremendously bullish implications over the next decade.
However, Gold breaking above $2100 is not quite a risk-off signal for the entire precious metals sector. At least not yet.
The breakout has started to pull Silver and the miners higher, but Gold remains the leader.
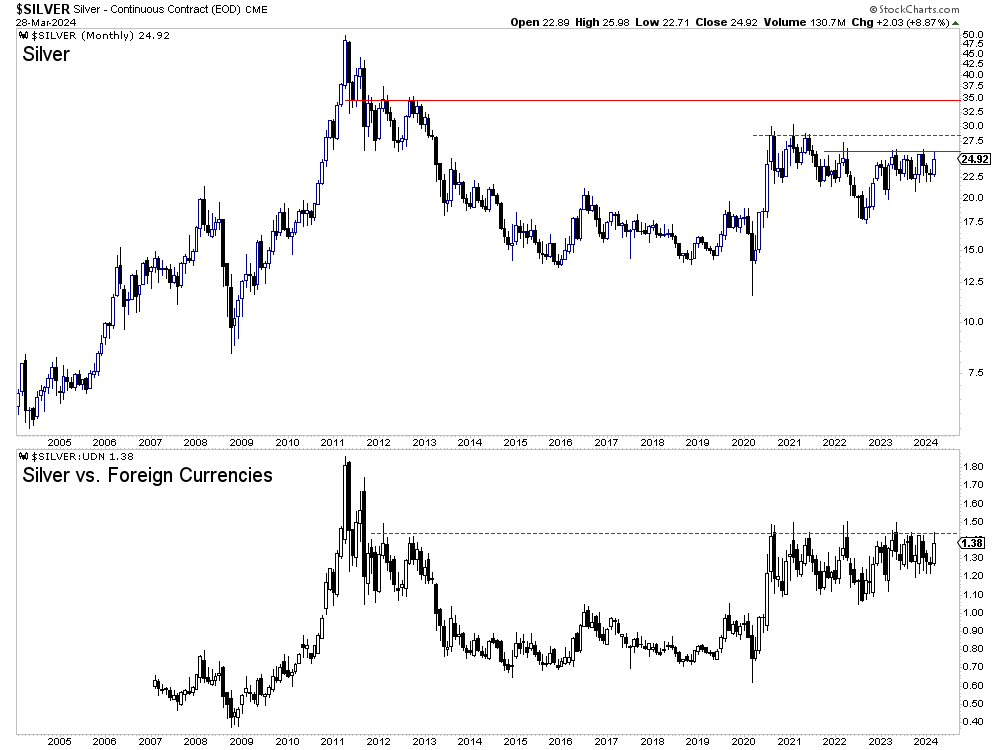
The next signal to watch is Silver breaking critical resistance at $26.
We plot the monthly charts of Silver and Silver against the foreign currency basket below.
A monthly close above $26 triggers a potential measured upside target of $34, the next major resistance. There is some resistance at $28.
Silver against foreign currencies is battling resistance that dates back to 2012. A breakout puts it in a good position to move towards the all-time high.

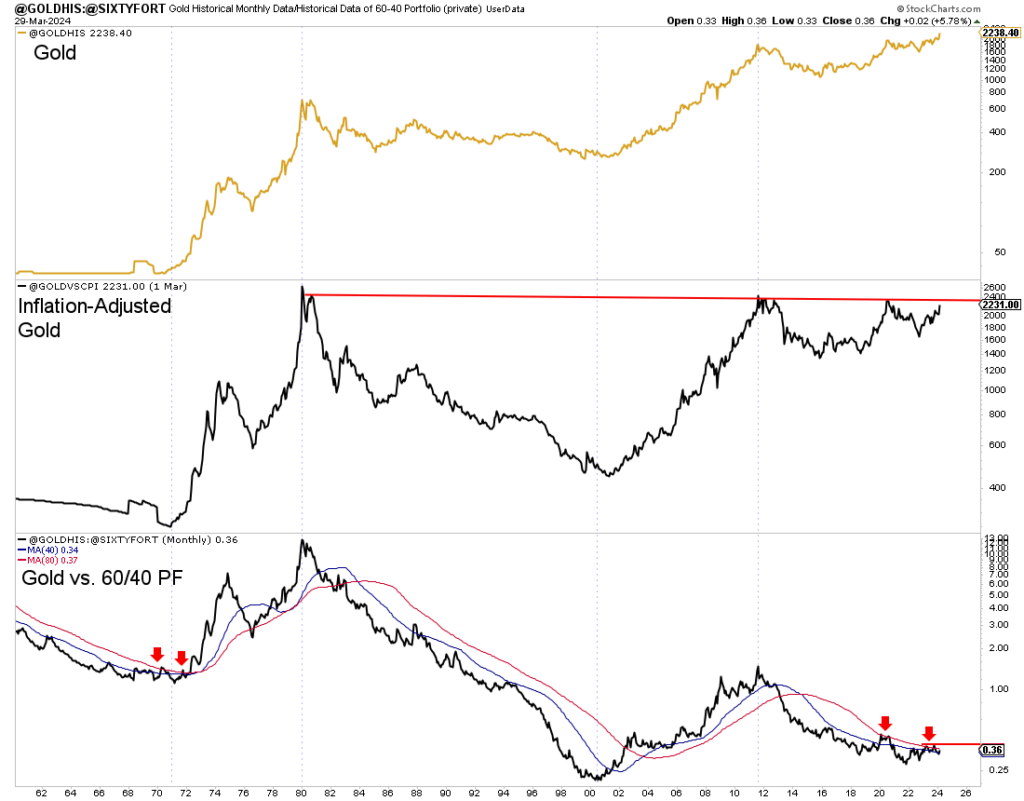
In the next chart, we plot Gold, the inflation-adjusted Gold price (middle), and Gold against the total return of a conventional 60/40 investment portfolio (bottom).
Gold against the 60/40 portfolio bottomed at the end of 2021, but it must move above the red line to confirm a new secular bull. That is 12% higher.
The inflation-adjusted Gold price is moving closer to breaking out of a 45-year range.

Gold has broken out in nominal terms and is moving towards measured upside targets of $2350 and $2500.
The next sector breakout to anticipate is Silver, breaking $26. Gold should soon follow that in inflation-adjusted terms, breaking out to a new all-time high.
Gold confirming a new bull market against the 60/40 portfolio is required for prices to move beyond $3000 and much higher levels.
These breakouts are the next signposts for this fledgling new trend.
At present, Gold is only days past potentially its most significant breakout in 50 years. We should expect gold stocks, especially junior gold stocks and silver stocks, to dramatically outperform Gold over the next year or two.


