When and How Gold Will Begin its Bubble
The bull market in Gold is in its 12th year (globally it began in 1999) but has yet to exhibit any “bubble-like” conditions. In fact, we still see many people referring to this bull market as “the Gold trade,” as if its an aberration that needs to be reversed or corrected. That aside, we know that Gold is under-owned as an asset class. The very well respected BCA Research estimates that globally only 1% is allocated to Gold and that fits with some of the charts that I’ve shown in the past.
Institutional accumulation began in 2009 (e.g. Paulson, Einhorn) and we know that phase lasts at least a few years before a bull market gives birth to a bubble.
Part of the problem for Gold has been the solid performance of other asset classes through most of the Gold bull market. Stocks performed very well from 2003 to 2007 and from 2009-2010. Commodities performed well from 2001-2002 and in the first half of 2008. If stocks are doing well or if commodities such as oil and agriculture are performing well, it detracts from Gold. Gold performs its absolute best when the other asset classes underperform or don’t perform too well.
Let me explain the conditions and setup that will facilitate the birth of a bubble and Gold going mainstream.
First, stocks are going to peak in Q2 of this year and enter a mild cyclical bear market. The chart below details the previous three secular bear markets and the template that each follows. After the mid-point crash (i.e 1907, 1938, 1974 and 2008) the market rallied significantly over the next one to two years. After that rally stocks went into a mild cyclical bear market for several years.

Those periods were associated with rising commodity prices, rising interest rates and rising inflation. Sounds like history could repeat again.
In the next year there is a good chance that we’ll see stocks and bonds in a bear market, simultaneously for the first time since the late 1970s. It is at that point that hard assets will emerge and mainstream managers will no longer be able to ignore that barbarous relic. This could begin as early as Q2 of this year or as late as 2012. It is hard to say but we think it begins somewhere in the middle.
Here is why the backdrop will ultimately support Gold and not stocks or bonds.
Economic growth is simply too low and too meager to put any dent into debt to GDP ratios. The economy is recovering but the debt load is growing larger. Two trillion dollars was added to the national debt in FY 2010. The CBO just came out and projected a deficit of $1.5 Trillion in FY 2011. This is why monetization will not only continue but it will be more frequent and in larger amounts.
We already see the effects. Inflation is rising and interest rates may be in a new cyclical uptrend. These are the factors and not deflationary conditions, which will cause the next mild bear market and mild recession. We say mild because the private sector was in recession for three years of the last decade. The survivors are better able to handle any current difficulties. In fact, the credit markets and the global economy have improved. After a recession like 2007-2009, there tends to be a slow but arduous period of recovery for the private sector.
Slowing economic growth and a mild recession can give bonds a boost to some degree but it won’t reduce the need for monetization. Remember, from 2004-2007 we had a housing boom, strong global growth and the budget deficit declined. With no housing recovery in sight, the likelihood of higher interest rates and more of the budget devoted to interest expense, the reality is continued monetization. This doesn’t include the potential for bailouts to states and municipalities, which also comprise a part of GDP. No bailouts there and the economy will be affected.
In the early 1980s, we had the ability to raise interest rates and defeat inflation. This time around, there is no realistic and hope and no legitimate solution other than a new monetary regime. We all know the economy cannot grow out of this mess. Furthermore, we know that higher rates will only lead to eventual bankruptcy. Debt levels in the US, Japan and Europe are already too large. Higher interest rates will raise debt service costs and this will eventually lead to default or hyperinflation. Huge government debt wasn’t a problem 30 years ago.
We’ve discussed some macroeconomic factors but now let’s look at the charts so you can visualize the precious metals complex, where it is and where it is going in the next few years.
Technicals
Below we show the Nasdaq from 1982-1996. Note that the market essentially consolidated from year five to year eight of the bull market. It was from 1991-1993 that the market began its acceleration and then it became obvious in 1995.

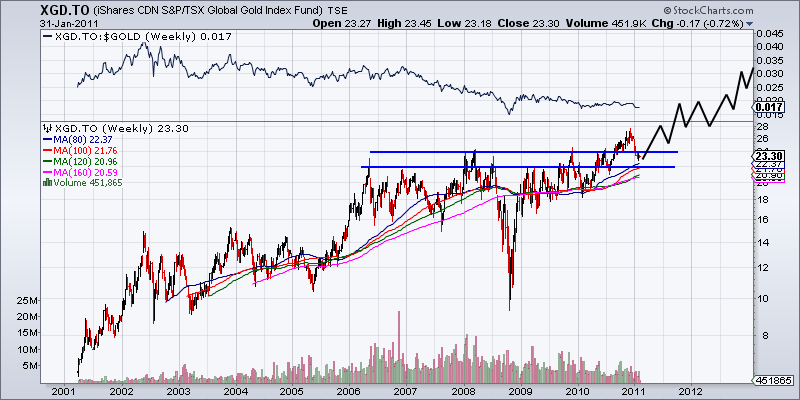
We show the Canadian Gold Stocks ETF as it smooths out the currency volatility. The market made a key breakout in 2010, is now retesting that breakout and by the end of the year will be in accelerating mode. The consolidation took place in year six to year ten of the bull market.
Our Junior Gold Index has been stronger as the 2006, 2008 and 2010 peaks are slightly higher than each other. However, the look is very similar. The current correction is serving as a retest to the 2010 breakout to new all time highs.

Our Junior Silver Index shows the breakout quite clearly. This correction is simply a retest of what was a multi-year breakout in a major bull market. This consolidation occurred in year six to year ten of the bull market.

Of course, the Godfather of all “breakouts” is the DJIA in 1983. While this was a breakout from a 16-year base (and not four or five year base), the process was similar. Breakout, retest then acceleration for several years.

Gold itself looks different as it has been leading the rest of the complex the same way it did in 1929-1930 and the 1970s. Note how its acceleration began in late 2005 and then again at the 2008 low. A move beyond channel 4, which halted the recent advance could engender a stronger acceleration than the one we’ve seen in the last 24 months.

Conclusion
Precious metals have been in a steady bull market for almost 11 years. During most of that time, stocks and bonds have performed reasonably well. Thus, mainstream advisers and managers could avoid precious metals and still generate reasonable returns. An example is 2009-2010. We expect this to change within the next 12 months. Stocks are very likely to enter a mild cyclical bear market while bonds are at risk of a new bear market. Certainly, without the massive monetization by the Federal Reserve, bonds would be in a bear market and rates would be higher.
If and when stocks and bonds enter a bear market it will be the first time they are in a bear market simultaneously since the 1970s. As the entire precious metals complex continues its upward climb, mainstream pundits and fund managers will be forced to buy in due to the other asset classes (stocks, bonds, real estate) being in bear markets. With a global allocation to Gold of only 1%, one can see clearly where things are headed. We are years away from a true bubble, but 2011-2012 could serve as the beginnings of a precious metals bubble as 1994 was for the technology sector.
Our charts show that this present correction is very likely a retest of multi-year breakouts. As we showed with the Nasdaq in the 1990s and the DJIA in the 1980s, markets tend to follow a retest with at least several years of acceleration to the upside.
Whether this retest lasts weeks or months isn’t the point. The point is to be ready for the period that follows. For our subscribers we are working on a top 10 juniors report for 2011-2012. Now is the time to find growth and high potential at a discount. Consider a free 14-day trial to our service as we seek to prosper from the bull market and bubble that lies ahead!
Good Luck!
Jordan Roy-Byrne, CMT
Jordan@TheDailyGold.com
Subscription Service


