Gold Near Term Analysis
By: Jordan Roy-Byrne, CMT
Taken From Recent Subscriber Updates
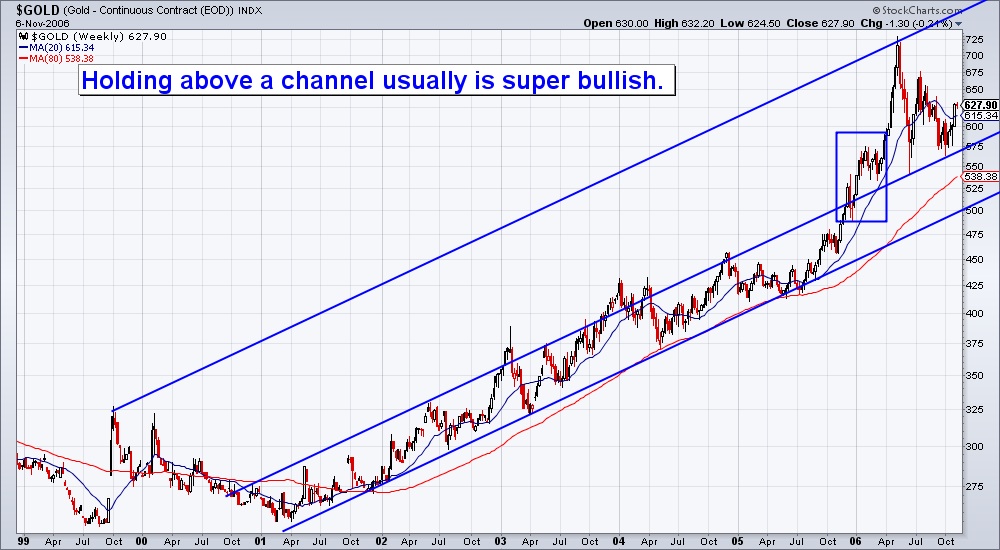
Can Gold hold the channel? What are we referring to? First, let us go back to the end of 2005. The chart shows how a parallel channel contained Gold’s move from 2001 to 2005. The first move above $500 reversed after hitting channel resistance. Yet, the market would immediately surge above the channel to $575. Then the market corrected for five weeks and two weeks later broke to a new high.


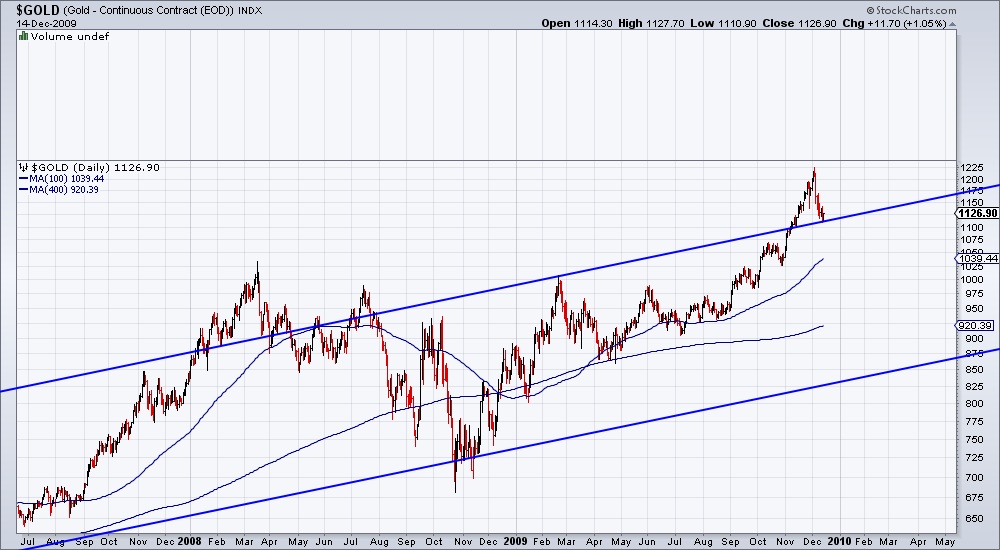
How is this relevant to today? Below we zoom in on the upper channel line, which connects the 1999 and 2006 high. Monday, the market rebounded from channel support. Pay attention to weekly closes. If the market can hold $1,115 on a weekly closing basis, it would imply an eventual strong breakout and follow through.
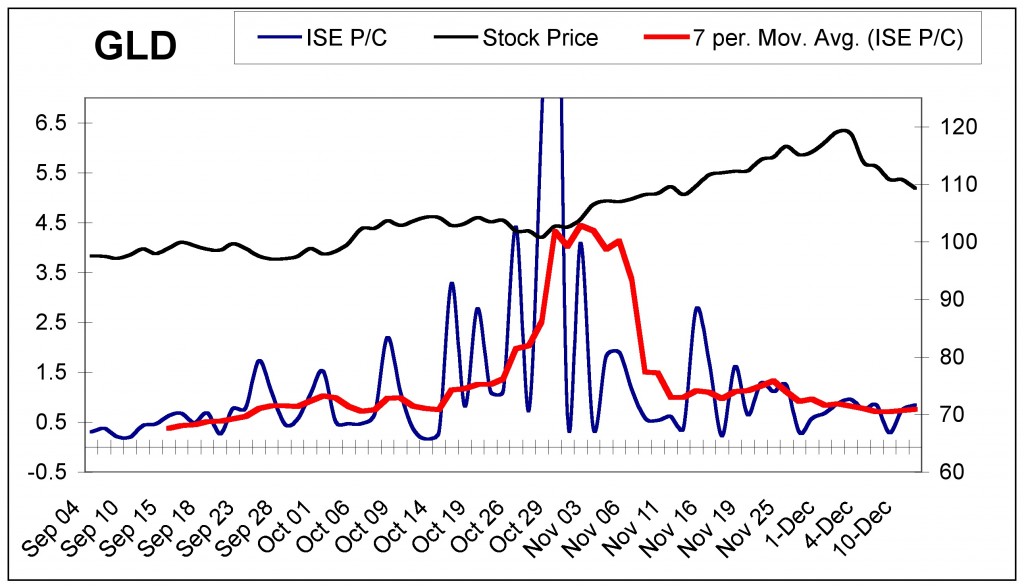
For immediate sentiment and market timing purposes we track the put-call data from the International Securities Exchange. This data, as a contrary indicator has provided strong signals and helped our market timing immensely. As you can see, the put-call on GLD was rising considerably into the end of October. The day it spiked to a new high was the day after GLD’s bottom. Since then the put-call has steadily declined. At present it looks close to increasing, but there is nothing to suggest an imminent reversal in GLD.
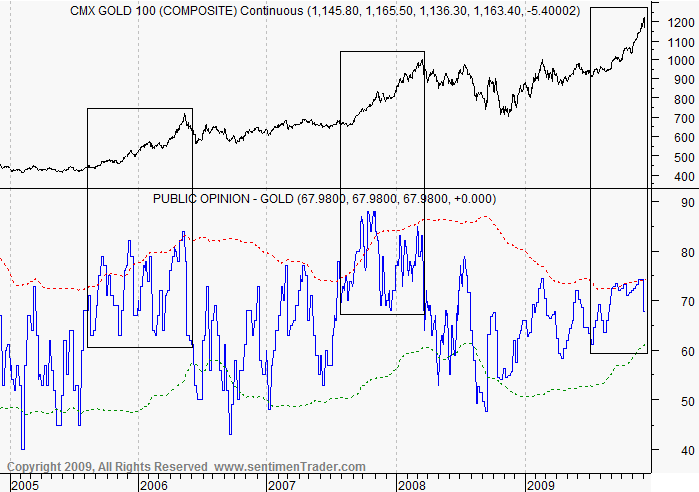
While options analysis portends to the immediate short-term, sentiment polls portend more to the medium or intermediate term. Below is the chart of public opinion, courtesy of sentimentrader.com. During the impulsive advances in 2005-2006 and 2007-2008, public opinion spent considerable time above 80% bulls. During the recent breakout, public opinion never exceeded 75% bulls.
Sentiment in the medium to intermediate term remains supportive for Gold. We suspect that after several more weeks of consolidation or weakness, the GLD put/call ratio will rise, thereby giving a bullish short-term signal. As always, we weigh sentiment along with the technicals.


