Deflation Delusion Continues as Economies Trend Towards High Inflation
By: Nadeem_Walayat
 Delusional deflationist right from the Bank of England MPC, to the mainstream press for well over a year have pushed the mantra of ongoing debt deleveraging deflation everywhere, everywhere that is than appears in where it counts i.e. the actual INFLATION indices, where inflation is on the rise right across the world as illustrated in the UK by the persistent failure of the Bank of England to control UK inflation that remains above the banks CPI 3% upper limit. Even Greece that really is in an depression is experiencing inflation at above 3%, whilst the US CPI continues to inflate at a more modest 1.2% as summarised below for key world economies.
Global CPI Inflation Rates
| India | 13.7% |
| Argentina | 11.2% |
| Russia | 5.5% |
| Brazil | 4.6% |
| China | 3.3% |
| UK | 3.1% |
| Australia | 3.1% |
| Euro zone | 1.7% |
| USA | 1.2% |
| Japan | -0.7% |
This is leaving aside the fact that the official inflation indices tend to under report real inflation rates as the methodologies have been manipulated LOWER over the decades so that governments can continue to stealth tax the population. For instance UK inflation as measured by the RPI which is the recognised measure for UK Inflation is at 4.8%, with my own real inflation rate measurement coming in at 6%. Whilst the U.S. CPI of 1.2% when measured on the basis of E.U. methodology that ignores Bush and Clinton tweaks comes in at 2.4% Then we have Mr Shadowstats who reports U.S. CPI inflation as being at 8.6% rather than the official 1.2%.
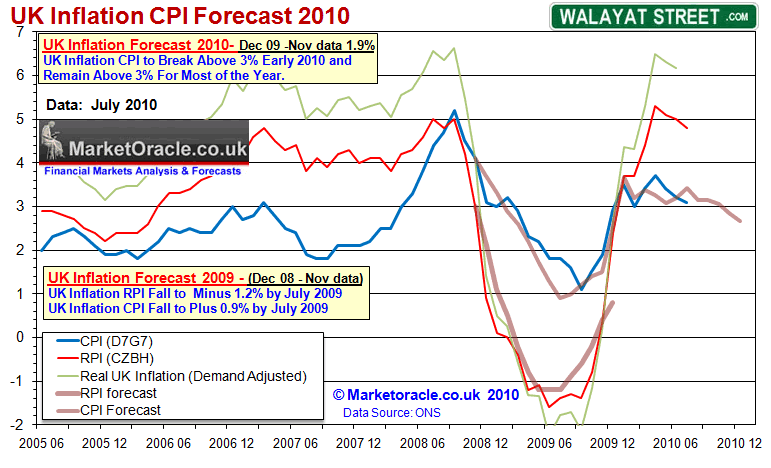
 I warned of imminent UK and global inflation mega-trend way back in November 2009 (18 Nov 2009 – Deflationists Are WRONG, Prepare for the INFLATION Mega-Trend ), as deflationists fell into the trap the debt deleveraging deflation red herring, that completely missed the big picture that I attempted to elaborate upon in the 100 page Inflation megatrend ebook of January 2010 (FREE DOWNLOAD) that contained the specific trend forecast for UK CPI Inflation of Dec 09 (UK CPI Inflation Forecast 2010, Imminent and Sustained Spike Above 3%) as illustrated by the below graph against which the Bank of England has continually issued statements that high inflation was just temporary and would imminently fall throughout 2010, the reasons for which I touched on recently upon in the article The Real Reason for Bank of England’s Worthless CPI Inflation Forecasts.
Debt deleveraging deflation completely ignores the fact that we are NOT living in the 1930’s, but in a GLOBALISED world economy that is seeing the CONVERGENCE of REAL GDP’s where the developing world is EATING up the worlds resources at a faster pace then the west is cutting back on consumption thus DRIVING INFLATION HIGHER whilst at the same time the west is engaged in COMPETITIVE CURRENCY DEVALUATIONS in an attempt to GENERATE NOMINAL GDP GROWTH which has highly inflationary implications.
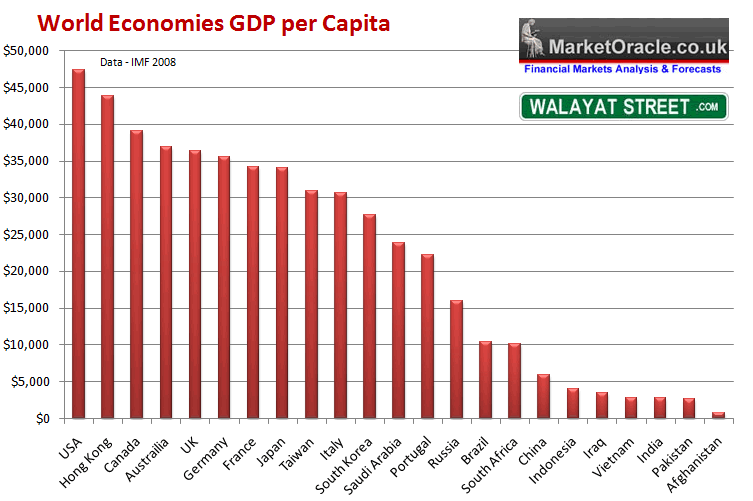
Governments attempting to inflate nominal GDP’s through printing money and near zero interest rates so as to push people towards consumption rather than savings because banks are paying LESS in interest than even the phony official inflation rates. Thus people increasingly seek to hold anything other than negative interest rate paying devaluing fiat currency that can be printed in the trillions at the press of a button. Savers in the UK are realising this as INFLATION EATS a life time of accumulated savings. Workers are realising this as the flow of paper currency raises prices in the shops far greater than the flow of paper into their pay packets that is coming in at an average of 2% against CPI of 3.1%. The paper currency is losing value at a much faster pace than the official inflation statistics, people are waking upto this and will increasingly demand payment in terms of ability to track the price of goods and services not official indices therefore demand wage rises above official inflation indices and thus triggering the dreaded wage price spiral, which as the trend for the convergence of GDP per capital analysis as illustrated by the below graph (Inflation Mega-Trend Ebook Page 54) shows for most people will only be a nominal phenomena i.e. they will not actually be able to purchase more as they will be fighting a losing battle against REAL INFLATION.
The threat of Debt debt deleveraging deflation has INFLATIONARY consequences because the governments will not ALLOW for actual Price DEFLATION because it would INCREASE the real value of government debt therefore increases the risk of governments going bankrupt as the debt interest rises, when the real intention is to INFLATE the real value of debt away. INFLATION is also one of the governments most important stealth taxes on the people whilst DEFLATION acts as a subsidy TO the people i.e. their standard of living INCREASES during DELFATION as prices fall whilst inflation gives the illusion of increasing standard of living as workers are stealthily forced to work harder for less real pay despite increasing productivity.
Debt Interest Spiral Inflationary Trend Towards Hyperinflation
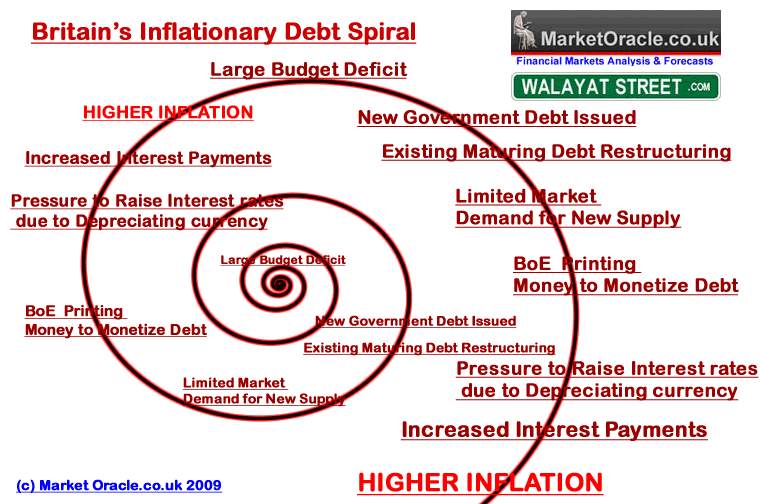
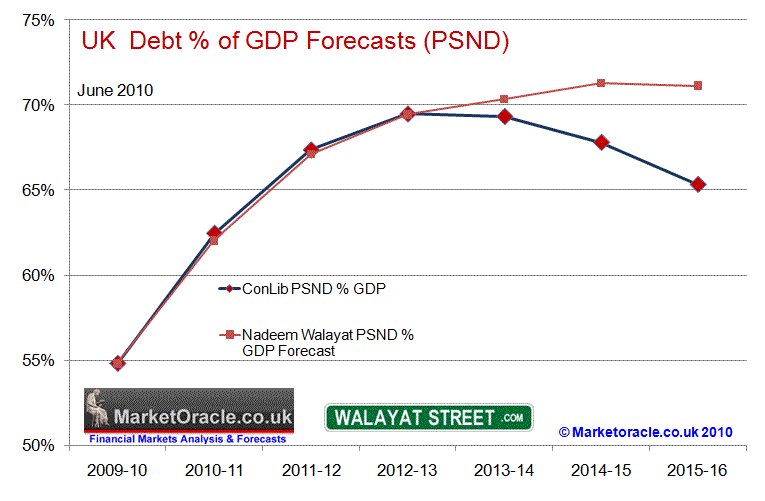
As warned off in November 2008 (28 Nov 2008 – Bankrupt Britain Trending Towards Hyper-Inflation?), the consequences of ever increasing debt mountain is the risk of igniting the debt interest spiral (03 Dec 2009 – Britain’s Inflationary Debt Spiral as Bank of England Keeps Expanding Quantitative Easing), since 2008 the Labour government had bent over backwards to ignite an election boom (03 Jun 2009 – UK Economy Set for Debt Fuelled Economic Recovery Into 2010 General Election), so as to maximise its chances of winning the next election. the New government is attempting to bring the debt interest spiral to an halt but as the recent debt interest analysis (29 Jun 2010 – UK ConLib Government to Use INFLATION Stealth Tax to Erode Value of Public Debt ) concluded the Government will not only not be able to halt the accumulation of total debt during the next 5 years but that official debt as a % of GDP is expected to continue to rise to 72% of GDP as illustrated by the below graph which suggests significantly higher debt interest payments i.e. a significant worsening of the governments fiscal position which means MORE money printing despite a economic growth as total public sector net debt rises by 50% to £1.26 trillion (2013-13) from £784 billion (2009-10).
The Inflation Mega-trends
The official CPI inflation indices illustrate the facts of what has actually transpired during the whole period of deflation mantra for the past 18 months.
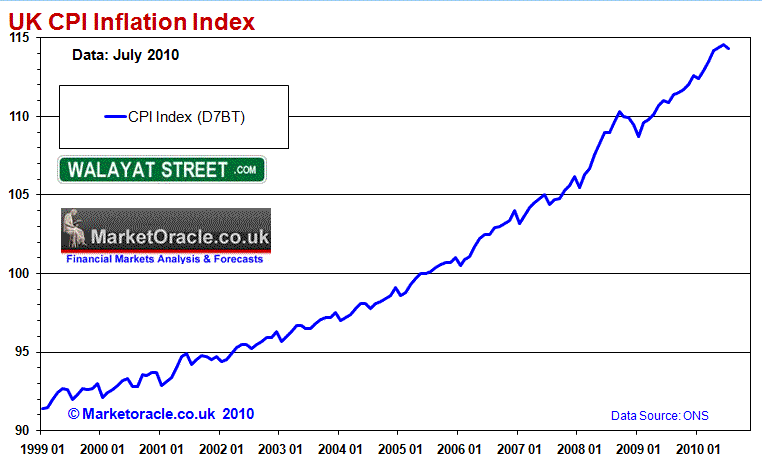
The actual trend for the UK has been of one of continuing accelerating inflation, where the great deflationary recession of 2008-2009 even barely a year on has become only vaguely visible as an inconsequential blip along the path of the Inflation Mega-trend. Do you see that little dip right at the very end of the above graph ? Well that inconsequential non event is yet again being taken by the mainstream press and Deflationists to run and cry deflation, just as every single minor downward blip during the past 18 months has been followed by something similar, if this type of reaction is not delusional than what is it ?
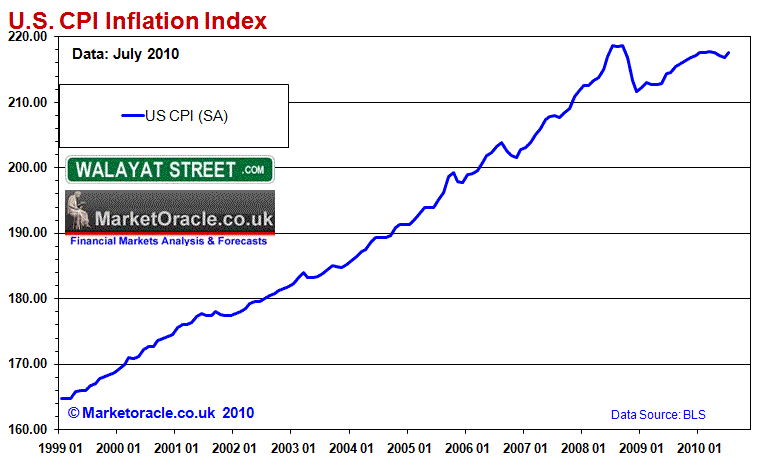
Meanwhile, the United States has experienced mild inflation since the Great Recession of 2008-2009 began with little overall change but with a positive trend. However this is set against the mantra of deflation that implies the complete opposite of what actually has transpired despite the worst recession since the Great Depression. So all of the talk of the U.S. being in deflation for the past 18 months has been delusional which does not match the reality of what actually has taken place and given the ongoing multi-trillion dollar deficits look set to feed a trend for a stagflationary economy for the U.S. for many years.
Delusional Deflationists Ignore CPI
Having been wrong on deflation in even the officially doctored CPI for the past year, delusional deflationists IGNORE this and any other indicator that implies inflation by picking and choosing any obscure measurements that implies deflation is taking place such as pricing assets in terms of the gold price to imply deflation is taking place when peoples food baskets i.e. the REAL WORLD show INFLATION is accelerating away from them, or in some cases implying that inflation is really deflation in disguise because of loss of purchasing power, which is the whole point of what inflation IS ! Where prices rise to erode the purchasing power of your savings and earnings! I hear weak economies mean deflation looms, well try telling that to Zimbabweans!
Do a simple personal inflation test, dig out your credit card statements from 1,2,3 years ago and see how much your food and energy bills have gone up and then you will know how much inflation has taken place during a period of perma deflation mantra. Never mind the amount average food baskets are destined to rise in price going forward!
Quantitative Easing / Money Printing
During 2009, Central Banks detonated the nuclear option of quantitative easing, the Bank of England will under the new governments regime seek to continue QE as part of its monetary policy. Central banks also have the bigger nuclear option of starting to charge banks interest on holding reserves at the central bank which would be highly inflationary as it would force banks to lend.
In the United States the prospects for QE2 ahead of the November mid-terms is growing and coming as a surprise to many quarters when it has been obvious since the first print run that once started money printing cannot be stopped whilst large budget deficits exist, which where the U.S. is concerned probably means continuing for the next 10 years at least as the U.S. is going to milk its reserve currency advantage to the fullest. So all the talk by the press earlier in the year that Q.E. had come to an end and would be unwound has been found out to be completely WRONG. Again, as I mentioned right at the start of QE in March 2009, once started money printing cannot be stopped whilst huge budget deficits exist EVEN AFTER RECESSIONS END. Therefore rather than be withdrawn or unwound, given the poor deficits outlook for the UK and US, we can expect QE to morph into a permanent feature of monetary policy.
The bottom line is that the QE already has yet to feed through to the financial system, i.e. UK £200 billion of money printing as a consequence of the fractional reserve system ultimately resolves into total money supply expansion of between £1 trillion and £4 trillion, which is highly inflation and already manifesting in what the Bank of England calls surprisingly high inflation and in the U.S. the $2 trillion of money printing to date looks set to be followed by at least another $1 trillion this year. So the seeds of high inflation have already been sown that will be reaped during the coming years.
Given the structure of the western economies, all that quantitative easing will do is to boost asset prices and emerging market economic growth and give an extra lift towards feeding the inflation mega-trend for many years.
Negative Real Interest Rates
At the end of the day the current situation of negative real interest rates is NOT deflationary it is INFLATIONARY as witnessed by official inflation indices that range between +2% to +4% rather than -2% to -4%.
Why ?
Because negative real interest rates erodes the confidence of people to hold fiat currencies. Workers are more eager to spend, savers are definitely more eager to seek escape from an obvious theft of value when banks are paying 2% against CPI of 3.1% and RPI of 4.8%. They are more likely to SPEND and invest in assets other than fiat currencies which is defacto reduction in the confidence of a population in holding the countries currency.
That’s the reason why Gold is above $1200 rather than $600 that prominent permanently deluded deflationists have been espousing these past few years as to what ‘should’ happen.
The Myth of Japanese Economic Depression and Deflation
Deflationists in the mainstream press and BlogosFear constantly perpetuate the myth that Japan has been in a Deflationary depression since the housing and stocks bubble burst in early 1990. One would imagine that the Japanese economy is perhaps 30% smaller with prices 30% cheaper given the repetitive mantra . But what about the facts ? The facts are that the Japanese economy has NOT crashed by 30% i.e. in depression during this time period but grown in virtually every year up until the 2008 global recession to stand at a GDP of some 20% higher than where it was when the bubble burst.
Price Deflation ? – Another myth. Despite the fact that innovation and increases in productivity should drive prices down, Japan’s consumer prices have have not fallen but are in fact marginally higher than where they were in early 1990. Therefore what Japan has experienced is stable prices NOT DEFLATION.
Yes Japanese asset prices, namely stocks and real estate have suffered greatly, however this is as a consequence of the bursting of the bubbles that saw prices TRIPLE during the preceding 5 years that turned safe assets such as houses into over bid gambling casino chips that were priced to discount a perpetual never ending boom. Therefore prices fell to reflect reality such as that it was ridiculous for the city of Tokyo in 1990 to be priced to have a greater value then the whole of the United States!
So when you hear about the US following a Japanese style deflationary depression, what you really need to understand is that it is for one of low economic GROWTH with STABLE prices. However the USA is NOT going to follow that model as the USA does not have the demographics of a shrinking ageing Japanese population which really SHOULD result in DEFLATION and a contraction in GDP which Japan through continuous innovation has NOT suffered. If there are far less workers generating MORE economic output then is that really an economic depression?
Commentators have been pointing to Japanese Debt soaring to now stand at 200% of GDP as highly deflationary when the OPPOSITE is true, as when the japanese debt bubble bursts which it surely will, then it will be highly inflationary if not hyper inflationary as Japan is forced to wipe out the value of its debt
Japanese the Real Gold Bugs
Whilst in the west buying gold for wealth preservation has yet to impact on ordinary people to any significant degree, ordinary Japanese recognising their ever growing debt mountain would ultimately destroy the Japanese currency were buying gold nuggets from their local gold dealers in preparation for hyper inflation 5 years ago! Needless to say despite that not having happened to date, the Gold price rising to $1250 reflects the increased global risks of debt bubbles bursting into high inflation.
Bottom Line – There has been no Japanese Deflation or Economic Depression. Western countries such as the UK and the USA are NOT Destined to follow the Japanese experience as their demographics are primed both for greater nominal GDP growth and price inflation.
Delusional Deflationists Point to Treasury Bond Market to Illustrate Deflation
Deflationists point to imminent deflation and a double dip recession by pointing to the treasury bond market yields plunging towards the credit crisis lows whilst at the same time continuing an 18 month mantra of the stocks bear market rally whose end is always imminent with the most recent plethora of commentary concluding that it has ended (again) and the bear market has resumed.
However the facts are that it is bonds and not stocks are in a bull market that is coming to the end of its life and entering the final manic stage that tends to see markets go parabolic. I am sure in recent weeks you have heard at length as to why bond investors are smarter and thus why the bond rally will go on and on, to me that sounds a lot like the tek stock investors during 1999, they too saw themselves as very smart just as the bubble popped. Every bubble participant thinks its different for them than every other bubble that’s popped before, however it NEVER IS! The bond market investors are in total denial of the fact that the U.S. is firmly on the path towards bankruptcy because the US has given NO SIGN that it intends on bridging the forecast $200 trillion fiscal gap between future revenues and liabilities, a gap that can ONLY be filled by printing huge amounts of money triggering very high INFLATION, which will DESTROY the real value of bonds as in purchasing power terms they will just become confetti paper. Against this stocks that consistently pay high dividends can be expected to retain much of their purchasing power, where my focus is on dividend paying stocks because it is more difficult to engage in corporate fraud Enron style if a company is actually making dividend payments.
The Global Bond Market Bubble
The key drivers for the global bond market over the past 20 years has been China and other emerging markets such as India exporting deflation abroad as they industrialised and produced ever cheaper goods and services to drive down costs thus enabling prices in the west to fall, this has now reversed where China is exporting inflation abroad as its workers now start to demand a higher standard of living and the country increasingly looks towards domestic consumption to generate economic growth. On top of this we have the ever expanding supply of bonds that no matter what the central bankers state is not going to diminish (pay down the debt) for either the UK, USA or most of the developed countries during the next 5 years at least.
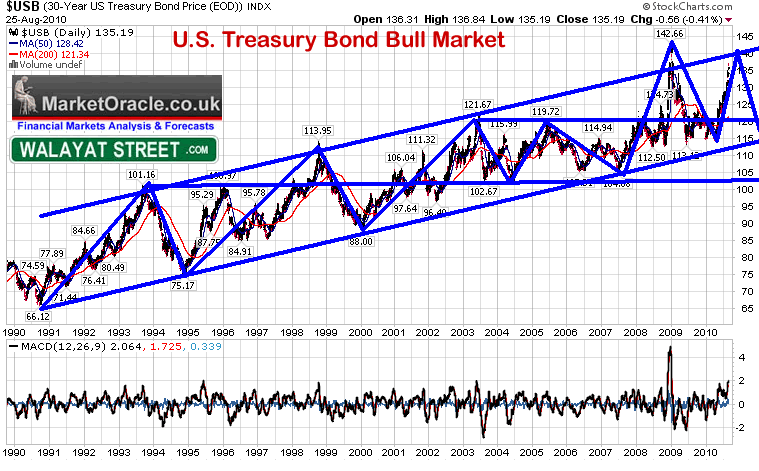
The 30 year treasury bond market graph shows a clear long-term uptrend punctuated by several speculative spikes higher amidst’s a so called dash for safety during 2008 and at the present time though there is no Lehman style crisis on the horizon, that just as 2008 resolved towards a swift plunge back towards the long-term trendline so will the current bond market rally just as the mainstream media becomes most vocal in its commentary for bonds being a safe haven destination for investors. If the 20 year bull market trend pattern persists then further upside is limited in favour of a trend that targets a move to $USB 120 to 115 over the next 9 months. So those that have bought during the past 6 months are going to be sitting on losses in about 6 months time.
The 20 year graph for US treasury bonds as a proxy for the Global Government Bond Market bubbles has investors drowning in delusional deflationist ideology that suggests bond prices can keep rising ever higher, when the actual fact is that the bond market is very close to a significant reversal point. This is a manifestation of the reinforcement of belief that this time it is different for this bubble, just as the housing market bubble participants thought that house prices would keep rising for ever because it was different, and before then the dot com bubble could not be priced on the basis of what had gone before because the Internet meant that this time it really was different – IT NEVER IS DIFFERENT!
Off course one of the best inflation mega-trend hedges are Index Linked Government Bonds, and up until recently NS&I Index Linked Certificates, as the new government pulled the plug on these inflation hedges due to the fact that they are paying out 6% per annum TAX FREE, RISK FREE to savers during 2010 and rising to 7% during 2011. Against which the bankrupt tax payer bailed out banks cannot compete that typically pay less than 2.5% that is TAXED at 20% or 40% depending on ones tax band. For 50 pages on how to protect your wealth Download the FREE Inflation Mega-Trend Ebook
The Bottom Line – The global economy is not contracting it is growing by a decent 4.1% this year with similar 4%+ growth for 2011, the emerging markets are more than picking up the slack for the weakly growing western economies as a consequence of high levels of debt AND converging GDP per capita. This ensures that upward pressure on inflation will remain for western economies despite the downward pressure on real wages as the living standards of the east and west converge. For the west this means high inflation as governments attempt to inflate nominal GDP and wages to give the illusion of growth whilst in the east there will be currency appreciation coupled with strong economic growth and higher inflation that will be exported to the west.
What Investors Should Do
The U.S. Fed and the Bank of England are going to keep printing money which is a big positive for asset prices such as stocks. For investors the strategy remains to invest in inflation wealth protection and growth such as agricultural commodities, gold, silver, metals and mining, TIPS, emerging economies such as China, India, Russia, Chile, Brazil, and developed economies such as Australia and Canada as their appreciating currencies will protect your investments purchasing power in sterling and dollars as covered at length in the Inflation mega-trend ebook (FREE DOWNLOAD).
The Protectionism Disaster Scenario
The disaster scenario is for that of one of protectionism to take hold which will fail to stop the trend towards convergence of GDP per capita between east and west, but it will result in a smaller economic pie i.e. global economic contraction, economic depression in the west and price deflation. This means the west would suffer whilst the east grows much more slowly. Protectionism would be a lose, lose outcome for all. The only real strategy the west has is to resign itself towards slow but sustainable economic growth as the emerging markets continue to grow to fill the huge gap in development that still exists between west and east.
Interest Rate Rises To Feed the Debt Interest Spirals
The debt interest payment pressures are set to accelerate as interest rates are forced to rise as a consequence of bond markets baulking at ever increasing supply of debt and rising inflation, UK short-end real rate interest rate of -2.6% is just NOT sustainable. Over the past 18 months borrowers have become drunk on extremely low interest rates (even if the banks are not fully passing them on) whilst inflation has started to rage in the UK during 2010 punishing savers and rewarding borrowers to entice them to take out even more debt.
What to Expect in the Future
The Bank of England WILL RAISE INTEREST RATES AND PRINT MONEY – This is contrary to anything you will hear anywhere else as the consensus view is that QE and Zero interest rates are complimentary, they will NOT be as we move forward! Because the Bank of England Will have no choice but to attempt to DEFLATE PRICES whilst INFLATING the Economy to achieve this it MUST RAISE Short-term Interest rates WHILST KEEPING LONG-TERM interest rates low. To achieve this the Bank of England needs to BUY Bonds and Stocks whilst forcing demand for consumption and wage increases lower. This WILL become the consensus view AFTER the FACT, perhaps in 6 months time ? Just as the mainstream press is ONLY NOW, 9 months on, starting to slowly wake up to the Inflation Mega-trend with the likes of the FT only coming to conclusions on the Bank of England Inflation targeting very recently, something that I came to several years ago!
FT – FT audit casts doubt on Bank’s forecasts – 9th August 2010
The forecasts used by the Bank of England to set interest rates are biased and contain little useful information, a Financial Times audit has demonstrated.
Nadeem Walayat – Bank of England’s Worthless 2% 2Year CPI Inflation Forecasts – 14th August 2008
The Bank of England’s in depth 48 page quarterly inflation report published yesterday concludes with the forecast for UK CPI inflation to be at 2% in 2 years time. Since the Bank of England first adopted the 2% CPI inflation target back in 2003, the Bank has perpetually made the same forecast for 2% CPI in two years time, and nearly always missed the target by a wide margin. Clearly there is something wrong in the banks procedures which appears to deliver the motions of generating paper work such as the 48 page report, followed by pats on the back rather than an effective response to the failure to meet the Banks primary objective.
The full implications of debt and the inflation mega-trend on interest rates as the UK economy recovers will be covered in my next in depth analysis, ensure you are subscribed to my always free news letter to get this in your email in box.
Comments and Source: http://www.marketoracle.co.uk/Article22199.html
By Nadeem Walayat
Copyright © 2005-10 Marketoracle.co.uk (Market Oracle Ltd). All rights reserved.
 Nadeem Walayat has over 20 years experience of trading derivatives, portfolio management and analysing the financial markets, including one of few who both anticipated and Beat the 1987 Crash. Nadeem’s forward looking analysis specialises on UK inflation, economy, interest rates and the housing market and he is the author of the NEW Inflation Mega-Trend ebook that can be downloaded for Free. Nadeem is the Editor of The Market Oracle, a FREE Daily Financial Markets Analysis & Forecasting online publication. We present in-depth analysis from over 500 experienced analysts on a range of views of the probable direction of the financial markets. Thus enabling our readers to arrive at an informed opinion on future market direction. http://www.marketoracle.co.uk
Disclaimer: The above is a matter of opinion provided for general information purposes only and is not intended as investment advice. Information and analysis above are derived from sources and utilising methods believed to be reliable, but we cannot accept responsibility for any trading losses you may incur as a result of this analysis. Individuals should consult with their personal financial advisors before engaging in any trading activities.


