Europe: How Much More Downside?
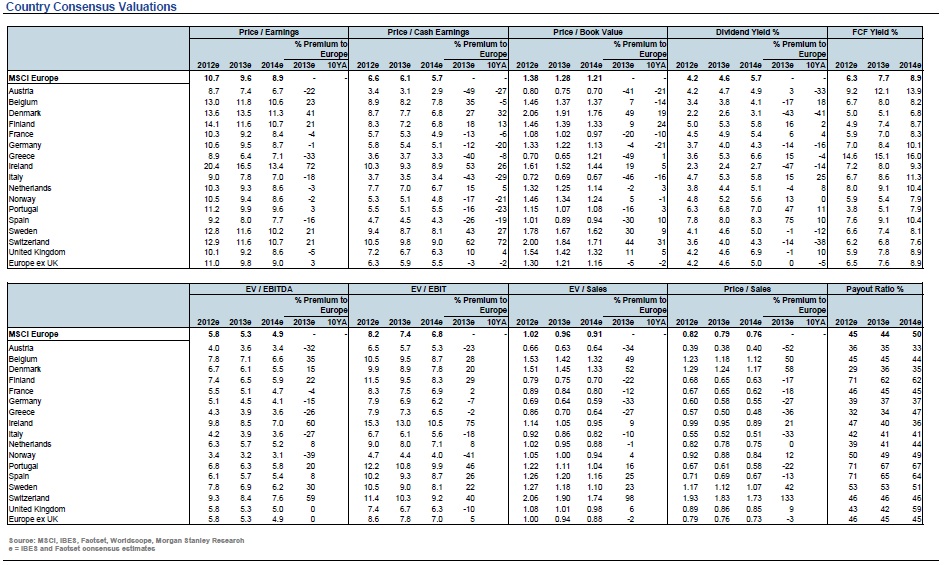
Here we post charts of three European stock markets as well as an index for Europe itself. Finally, we post some valuation data for Europe. We hope it lends some perspective to the day to day action.
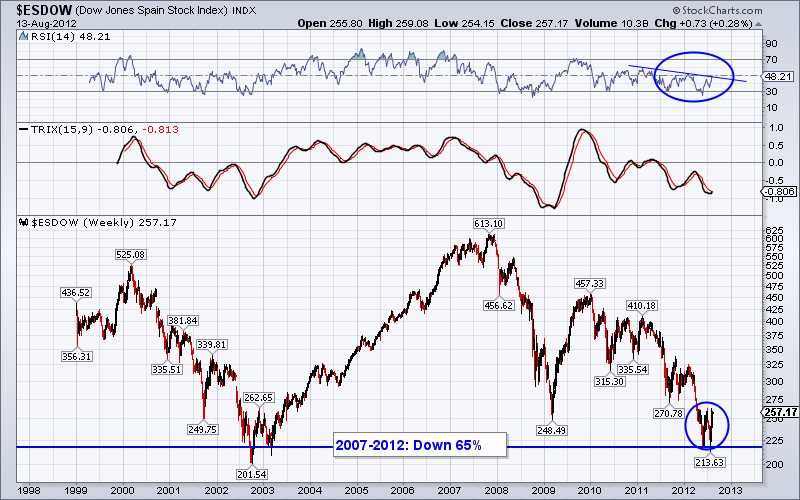
Here is Spain. It declined 65% from 2007-2012. Recent price action looks bullish as the market held long-term support.
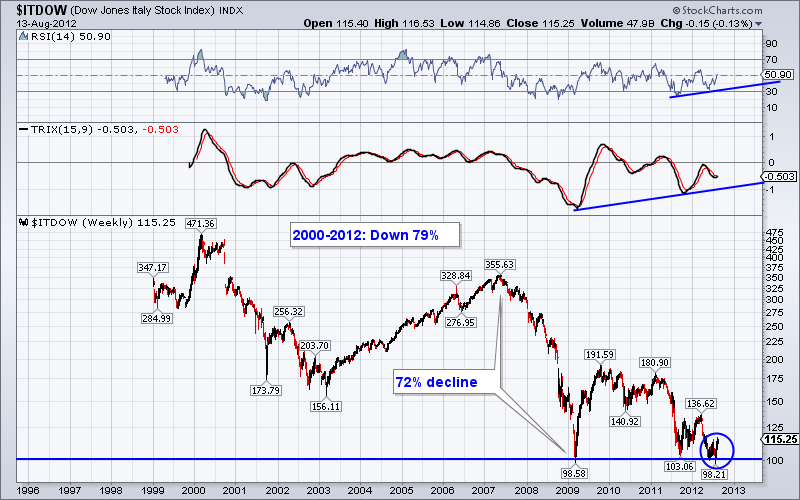
Next is Italy which from 2000-2012 declined 79%! It declined 72% from 2007-2007. Recent price action looks bullish.
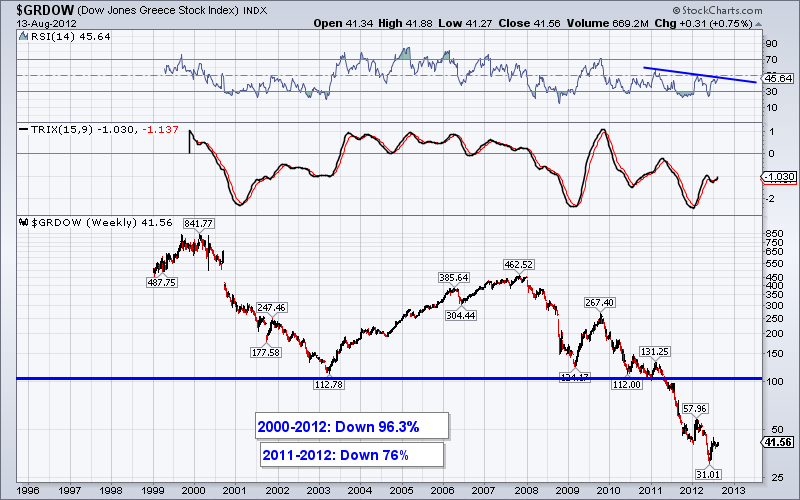
Greece fell 96.3% from 2000-2012. How much lower can it go?
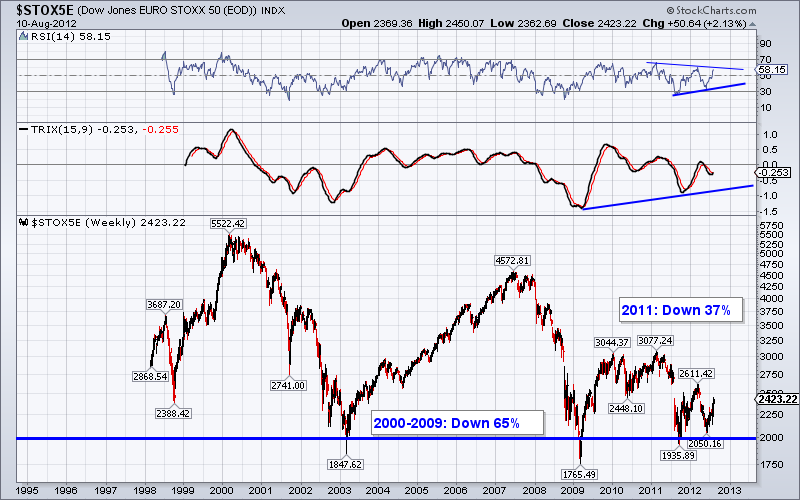
The DJ Europe 50 declined 65% from 2000-2009. Yes, that is 65% for markets which are the size of the US.
Finally, consider the valuations. Click to enlarge the chart. As of April, Greece was trading at 6.4x 2013 earnings, Italy at 7.8x 2012 earnings and Spain at 8.0x 2013 earnings. Europe ex-the UK was trading at 9.8x 2013 earnings. These markets have had a good run recently but are trading 10-15% below the prices used in these valuations.
To conclude I ask, how much lower can Europe go?
What does this mean for precious metals? We cover it in our premium service.
