Gold and Precious Metals Update
- Gold and Precious Metals
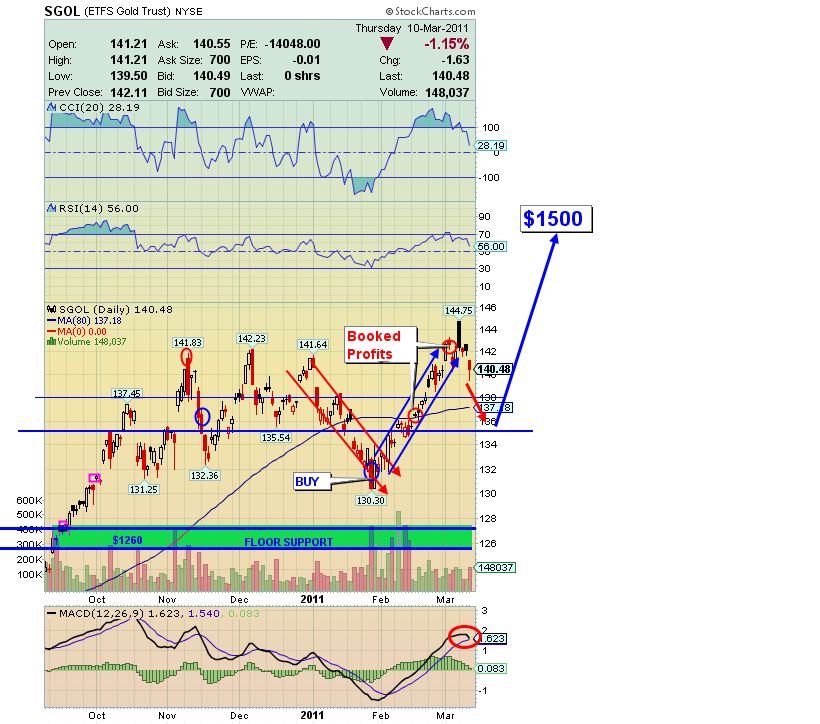
SGOL (Bullion Proxy) 6 Month Chart

SGOL 6 Month Chart Analysis
- A gold asset building program should be the centerpiece of your investment showcase. A week ago chart volume projected a correction in price, and it unfolded early this week as gold declined to $1380 on Tuesday.
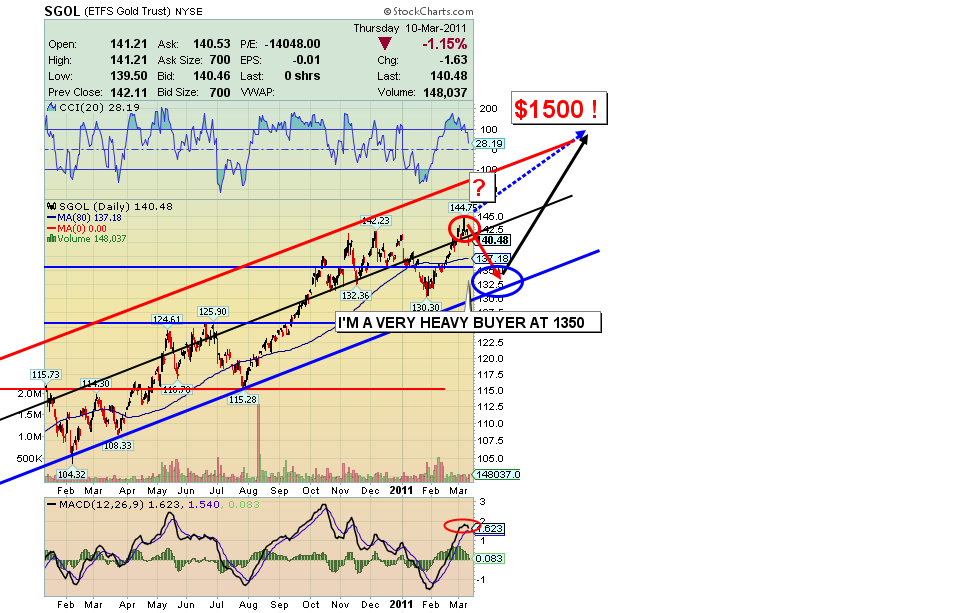
- I issued a number of fairly aggressive buy signals for gold and related assets into $1380, because although I see price going as low as $1325, this decline is potentially your last buying opportunity before price is out of here, to the upside!
- Gold is a precious metal, meaning there is precious little of it. Yet, gold is a dramatically under-owned asset. The mutual fund industry’s Investment Company Institute states that equities, bonds, and mutual funds are owned by most Americans, yet only 2% of US citizens own any gold.
- The likelihood of more money ultimately flowing into the gold market could cause backwardation, a situation in commodities where immediate demand outstrips supply, causing prices near future (spot) prices to trade higher than later delivery prices.
- It has already happened in the silver market. The shortage of silver caught that market by surprise and price skyrocketed. The same thing could happen to gold. Gold has traded above $1400 with only 2% of American citizens in the market. Can you imagine stock market money flowing in a panic into real physical gold? What would that do to the gold price?
- $4000 gold, here we come! When that happens gold enters phase three of the bull market. I have projected that if gold were to perform at the same level of the 1970s bull market it could trade at $6200! That is a thought to keep in mind during sharp but relatively small corrections like we had on Tuesday!
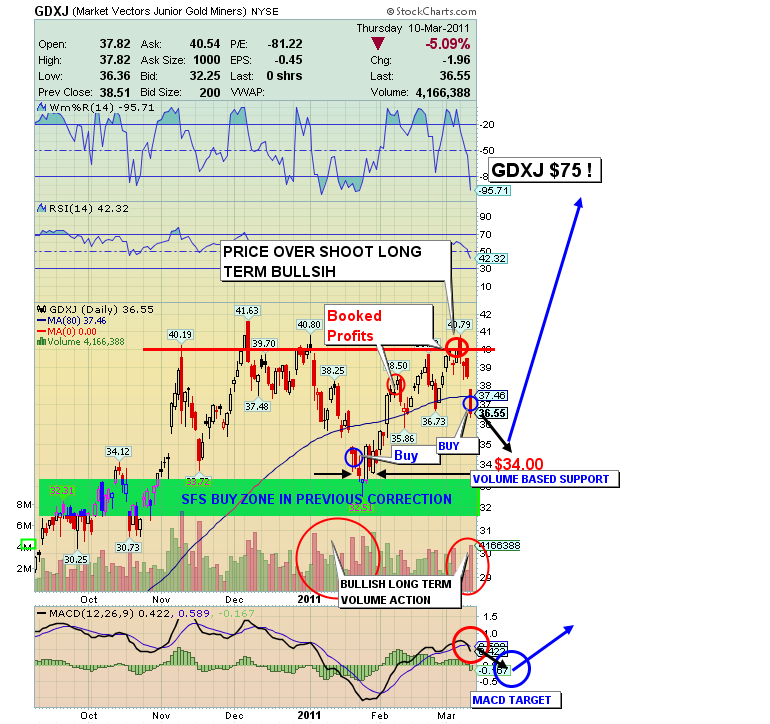
GDXJ Chart Analysis:
- I issued a buy alert for GDXJ at $34.20 on Tuesday, March 15. I am keeping a close eye on my gold bullion sentiment indicator. What happens there with bullion ties in closely to gold equities. The intermediate numbers are overall-positive for gold.
- My short term sentiment indicators, unfortunately, show more down side price movement is coming, and needed. Price cannot move dramatically higher until gold shakes out more of the weakest hands that came into the market in October and November, attracted by the big move up from the summer.
- For GDXJ, the short term sentiment situation should be fully resolved by one more brush with the volume-based support in the $32-50-$34.00 price area. GDXJ knifed into the target zone on Tuesday, and bounced strongly back out immediately. The gold juniors market is a lot stronger, fundamentally, than most realize.
- If gold bullion heads to my target of $1350- $1325 over the next few weeks, it will give gold stocks some problems. I would suggest you set your heaviest buys for GDXJ around $32.50, and that is where I am setting mine now.
- Long Term: My SFS Gold Stock Ratio projects a $75 one year price target for GDXJ. Beyond that, the target is an incredible price of $200 per GDXJ share.
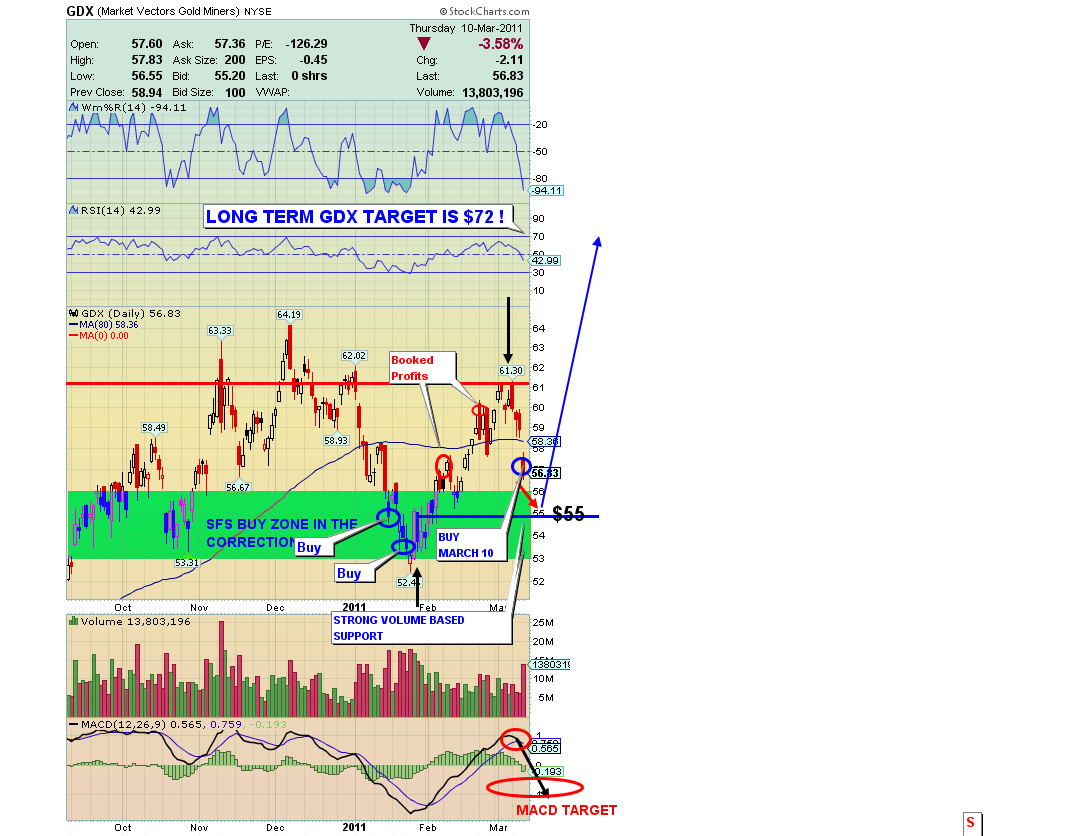
GDX 6 Month Chart Analysis
- On Tuesday I issued a GDX buy signal at $55.01. The key level to watch is the volume based support that sits in the $52.50-$55.00 price zone. Expect this key area to be challenged before GDX gets the upside show on the road. Further weakness in Gold, with the S&P500 continuing its correction, could send GDX to test the lower part of the $52.50-55 target zone.
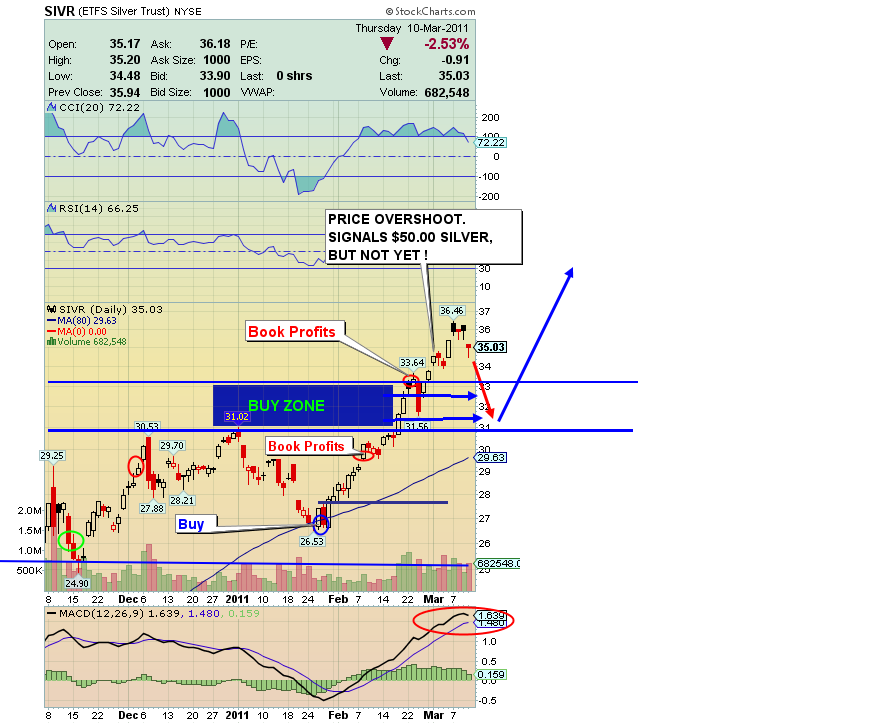
SIVR (Silver Proxy) 6 Mth Chart
SIVR Chart Analysis
- I gave issued a profit taking alert for SIVR at $33.26. I foresee more corrective action, followed by SIVR hitting my $50 price target inside of 12 months.
- Owning the physical product is an absolute necessity. As I get fresh buy signals in silver, I put more money in physical silver. My latest buys were at $28. Use my buy signals to buy SIVR, and to add to your physical Silver inventory.
US Stock Market
SPY Chart Analysis
- On Feb 15th I issued a strong sell and short sale signal for SPY, the S&P500 proxy. Since then the market has been slammed. My sentiment indicator and distribution volume days are indicating the market is extremely weak, technically.
- One of tools I use at is the cash indicator (C.I.); this tool measures cash levels held by mutual funds. The C.I. indicates how much buying power is available to buy the market, and move it higher.
- The C.I. has previously warned of serious trouble in the stock market. The bad news now is that only approximately 3% cash is on hand at funds now, one of the lowest cash levels in 50 years!
- Low cash levels are typical after an extended run in stocks, and that has just occurred. More and more cash has gone into the market, depleting sideline money, which in turn depletes fuel to push the market higher. If the market falls, mutual fund investors will redeem shares. Many of these investors are already in personal financial difficulties, because the real estate market has not bounced back. A decline in the stock market that goes deeper than people are expecting could cause a serious panic.
- Bottom Line: Some profits should be booked, and you can re-short the market again as it mounts a small rally. The Dow fell 800 points, which is more than 5%. That is a solid profit for short positions I recommended you put on a few weeks ago. A lot more weakness in the stock market is probably coming, but rather than waiting for the lowest targets to hit, book some profits regularly, like you prune a hedge regularly in your garden.
- Remember that the main reason for shorting the S&P500 is to protect your gold stock positions. Use this strategy until the link between the stock market and gold stocks is finally broken. It has been exasperating waiting for that to happen, and unfortunately the link is still there. If the stock market corrects hard, you are going to be very glad to have insured your gold stocks with S&P500 short positions!
Unique Introduction For Web Readers: Send me an email to alerts@superforcesignals.com and I’ll send you 3 of my next Super Force Surge Signals, as I send them to paid subscribers, to you for free. Thank-you!
The SuperForce Proprietary SURGE index SIGNALS:
25 Super Force Buy or 25 Super Force Sell: Solid Power.
50 Super Force Buy or 50 Super Force Sell: Stronger Power.
75 Super Force Buy or 75 Super Force Sell: Maximum Power.
100 Super Force Buy or 100 Super Force Sell: “Over The Top” Power.
The Super Force alerts are sent by email to subscribers, for both the daily charts on Super Force Signals at www.superforcesignals.com
and for the 60 minute charts at
www.superforce60.com
About Super Force Signals:
Our SuperForce Signals are created thru our proprietary blend of the highest quality technical analysis and many years of successful business building. We are two business owners with excellent synergy. We understand risk and reward. Our subscribers are generally successful business owners, people like yourself with speculative funds, looking for serious management of your risk and reward in the market.
Frank Johnson: Executive Editor, Macro Risk Manager.
Morris Hubbartt: Chief Market Analyst, Trading Risk Specialist.
Email:
trading@superforcesignals.com
trading@superforce60.com
Super Force Signals
422 Richards Street, Suite #300
Vancouver, BC V6B 2Z4
Canada


