Gold At Long Term Trend Support, Key Level Highlighted
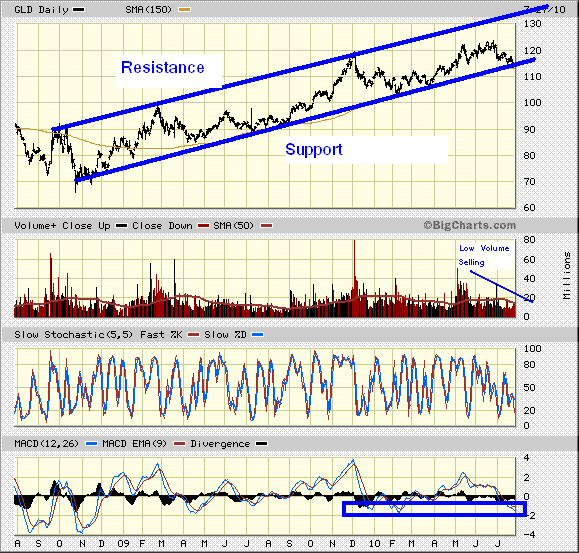
Gold is now reaching long term trend support after falling the last few weeks as investors returned to bid up the Euro and equities. The bounce in equities, especially financial, retail and real estate may be short lived as volume indicates that there is not much conviction from major investors on the upside. Gold has recently been the safe haven as investors sought shelter away from the Euro when it was having the sovereign debt issues. Now that those issues have been quelled, gold has had some selling and it has now reached an oversold condition and a long term trendline which is acting as major support.
Stock prices move in trends. In a bull market, it is quite often easy to identify the ascending bottoms. Being familiar with trendlines allows the investor to enter long term bull markets when they are oversold and at key support. An investor must always be aware of a stock’s underlying long term trend. This can be counter-intuitive and awkward, as most times when it comes down to support you have to think against the market herd and buy when others are selling. It’s like buying a winter coat in the heat of summer. Gold is on sale, and presenting a low risk, high reward trade, but it requires non conformity with the crowd which is not an easy task for anyone. Many of us like to be in what’s hot now situations, rather than seeing the bigger picture and entering into a trade when it is uncomfortable.
Gold is now at my buy point of the rising long term trend support line. GLD touched that line 6 times, which signifies that this trendline is a reliable point of support. The significance of this line is that it is not steep, which also brings a higher probability that GLD will find support here. It is also oversold. Continued weakness here and a break below this long term trend would be troubling and highly unlikely. If there is a break most likely it would be exhaustive, meaning that it will shake out a lot of shares before the next move higher. I do not see $1200 as a top in gold as there are no technical signs of a major top.
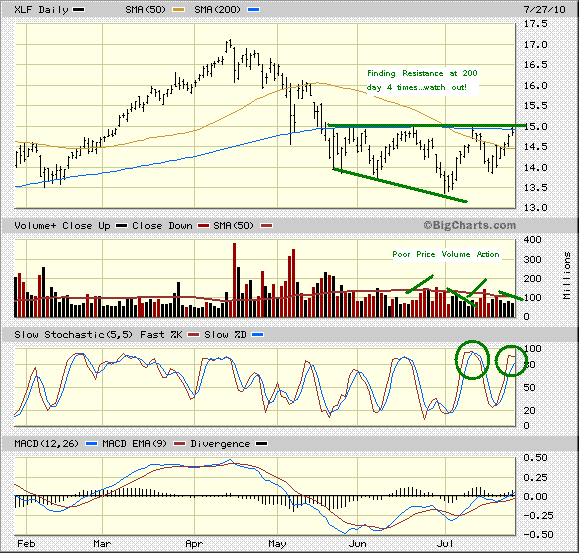
On the other hand, financial stocks may be finding key resistance here following a low volume rally. As investors are digesting earnings reports that claim credit is improving and lending is increasing, consumer confidence is weakening and the unemployment rate is still very high. A jobless recovery is what many are considering we are experiencing. It seems that this recovery has been good for wall street while main street has not seen an improvement. The financials have found resistance at the 200 day moving average and have now failed four times, significantly breaking through this point of resistance. Historically speaking, after a few failed rallies a major drop could occur.
At the writing of this article, housing has also had a significant reversal after recent data showing an increase in pricing in some metropolitan areas. Investors are selling home building stocks on positive news, which indicates that there is some caution over what the real estate market will resemble after the home buyer tax credit expires. The chart shows a clear reversal and I expect that the rally in equities will be coming to an end and that gold’s poor summer performance will be different this fall as many weak hands were shaken out. An explosive fall rally into new highs is expected as I still have a target of $1400 by year end.
Disclosure: I own shares in gold and silver mining stocks.


