Gold & Gold Stocks to Test Overhead Resistance
Recent price action in Gold and gold stocks suggests the worst of the correction is over. Gold has broken above initial resistance ($1835/oz), and gold stocks have shown sustained follow-through after registering an extreme oversold condition.
However, Gold has only broken out of a 5-month base, and a confluence of massive resistance is looming at $1900. Technically, on the daily chart, it needs to rally past $1910 to escape the pattern of lower highs.
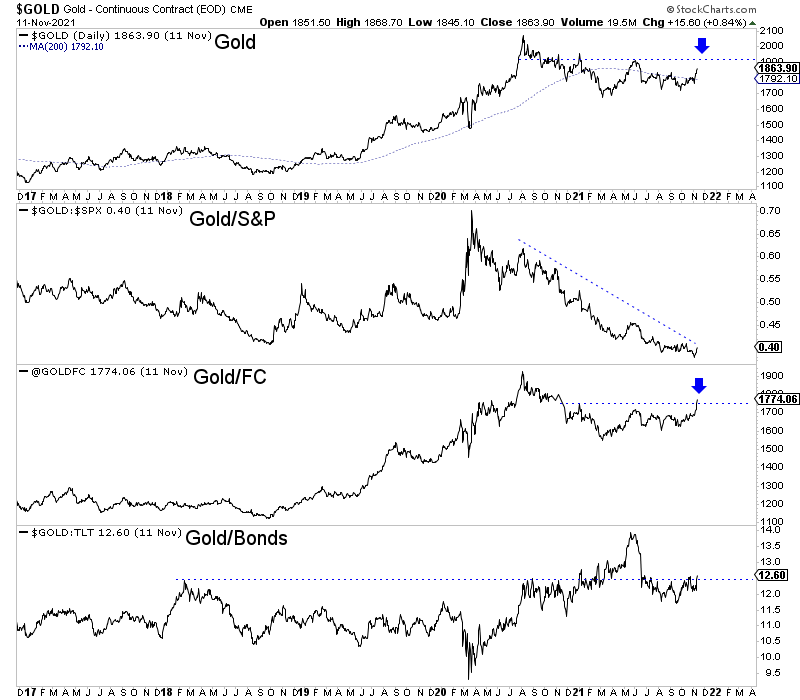
As we see below, the real breakout was in Gold/FC (foreign currencies), which reached a fresh 52-week high this week. Also, Gold has a good shot to rally back to its multi-year relative to Bonds.
The holdout is Gold against the stock market.
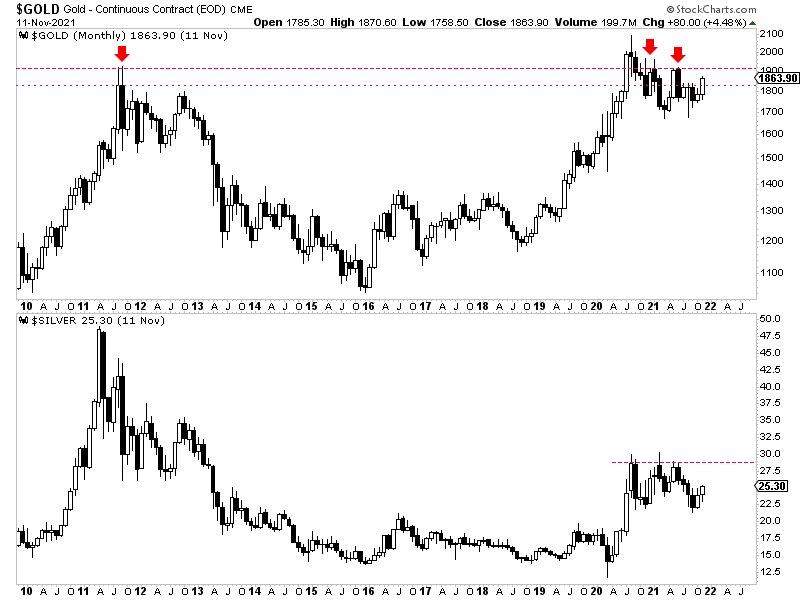
The month is far from over, but the monthly chart clarifies the big picture.
The real breakout will be when Gold makes a monthly close above $1900, a level at which Gold failed four times since the correction started.
Silver has a bullish head and shoulder formation on its daily chart that projects to $28. If Gold is almost at $1800, will Silver be able to rise another 10% to that target?
Gold needs to close above $1900 on a weekly and monthly basis to register a meaningful breakout, but even a curmudgeon like me can note the importance of recent strength.
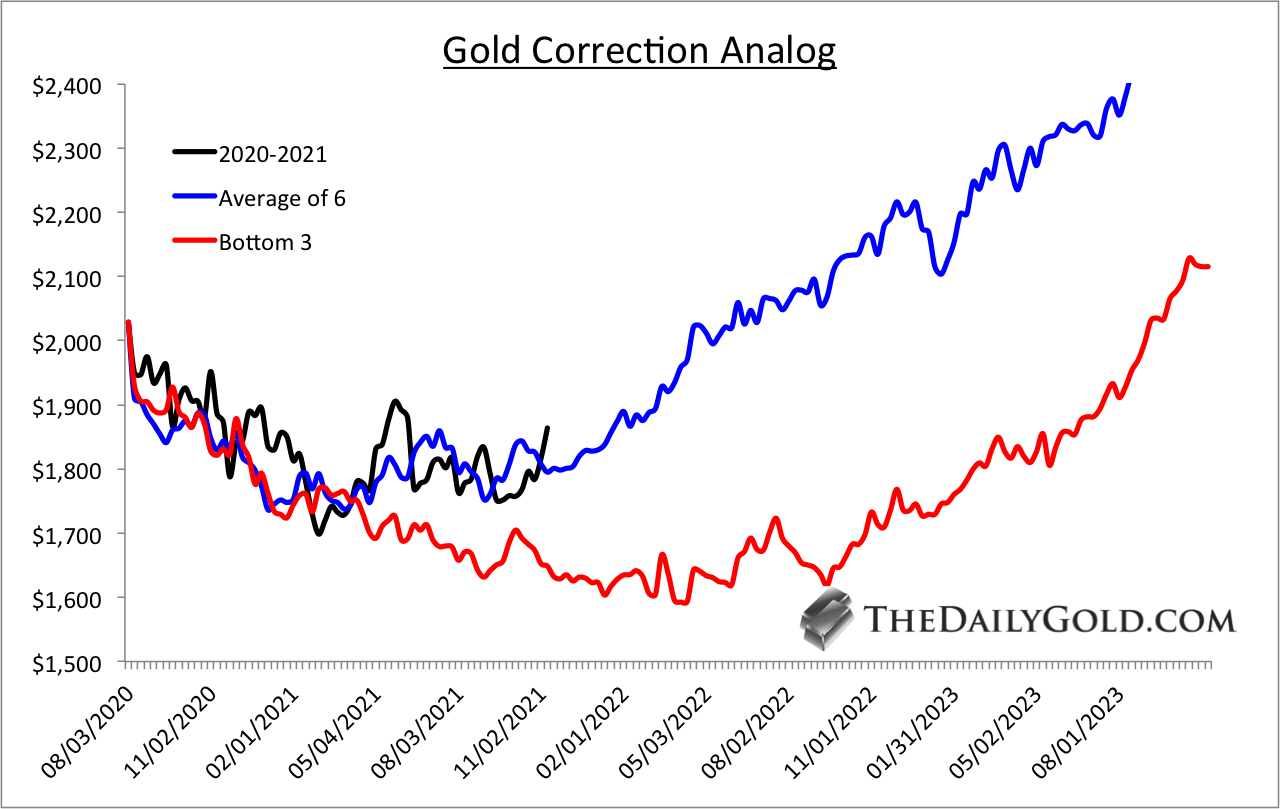
In the chart below, I plot the current Gold correction (black) along with the average of six historical corrections (blue) and the three worst of those six (red). As we can see, recent strength argues that Gold should remain on the blue path.
As Gold approaches $1900, we find the gold stocks are essentially at resistance.
The HUI and GDXJ have rallied back to their most important levels since 2013 (280 and 48), which nearly coincide with their 82-week moving averages, which have been excellent support and resistance indicators (blue arrows).
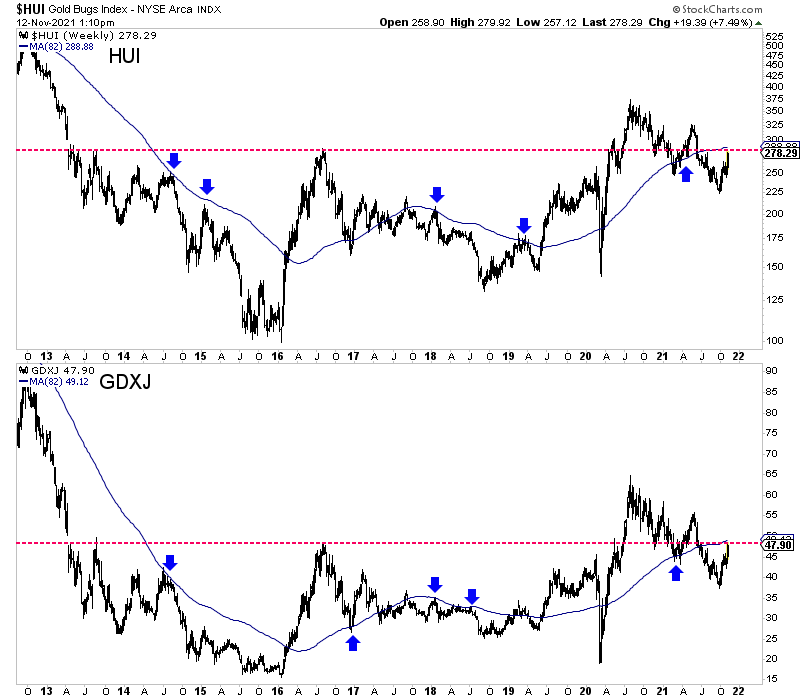
The recent action in this sector is positive and encouraging as it implies the worst of the correction is over and that if Gold can test $1900 again, it’s likely to break through in the coming months.
Gold’s next big move requires it to outperform the stock market, so keep an eye on that relationship. It hasn’t done so yet, although it has rebounded roughly $200.
Given the stiff overhead resistance at $1900 and its relative weakness against the stock market, Gold is unlikely to break out anytime soon. The correction analog argues for a breakout in March 2022.
Although many of our stocks have moved up, plenty of quality opportunities remain. I continue to be laser-focused on finding quality juniors with at least 5 to 7 bagger potential over the next few years. To learn the stocks we own and intend to buy, with at least 5x upside potential, consider learning more about our premium service.