Gold Leads but Gold Share Provide Leverage
Source: Gold Leads but Gold Share Provide Leverage
The following article entitled Gold or gold stocks? It depends on your confidence in the price encapsulates the public’s general understanding of gold and gold shares.
So what you have here are two different approaches, depending upon your confidence in the price of gold. If you’re particularly bullish (gold bugs fall into this camp), and believe that the current $1,200 an ounce is just the start of things, then investing directly in the commodity sounds like the best way to profit if things go your way.
On the other hand, equities are better suited to more cautious investors. If the price of gold flat-lines, investors won’t make a penny if they hold gold. But they will do just fine if they hold gold stocks.
The investment public, observing bullion lead of the gold shares to new highs since 2007, has assumed that it provides beta over the gold shares. The decline gold shares to gold ratio and side-by-side comparison of the two markets illustrates this general observation. Prior to 1968, officially 1971, gold was unable to lead as its price was fixed.
S&P Gold (Formerly Precious Metals Mining)* to Gold Ratio:
* S&P Gold from 1945, Barron’s Gold Stock Index from 1939-1945, 1922-1939 Homestake Mining:

It is a common misconception that the gold shares lead gold to new highs. The yellow boxes in the chart below represent the lag between new highs in gold and gold shares.
Gold and Gold Stocks Side by Side Comparison:

This short-term leadership, however, does not imply that gold will outperform the gold shares over the course of a bull market. Quite the contrary, the message of the markets is exactly opposite. If you’re bullish on gold, solid well-run gold companies provide superior returns over gold.
This leverage is reflected in not only earnings but also dividends. Most listed gold share and ETFs as capital appreciation indexes completely ignore dividends. Dividend payouts from gold shares rapidly increase as the bull market matures. The dividend payout of homestake mining from 1924 to 1935 in the chart below reveals the contribution of dividends on the total return. This rapid payout increase was and will be repeated in the 1968 to 1980 and 2000 to 2015 run, respectively.
S&P Gold (Formerly Precious Metals Mining)*
*S&P Gold from 1945, Barron’s Gold Stock Index from 1939-1945, 1922-1939 Homestake Mining
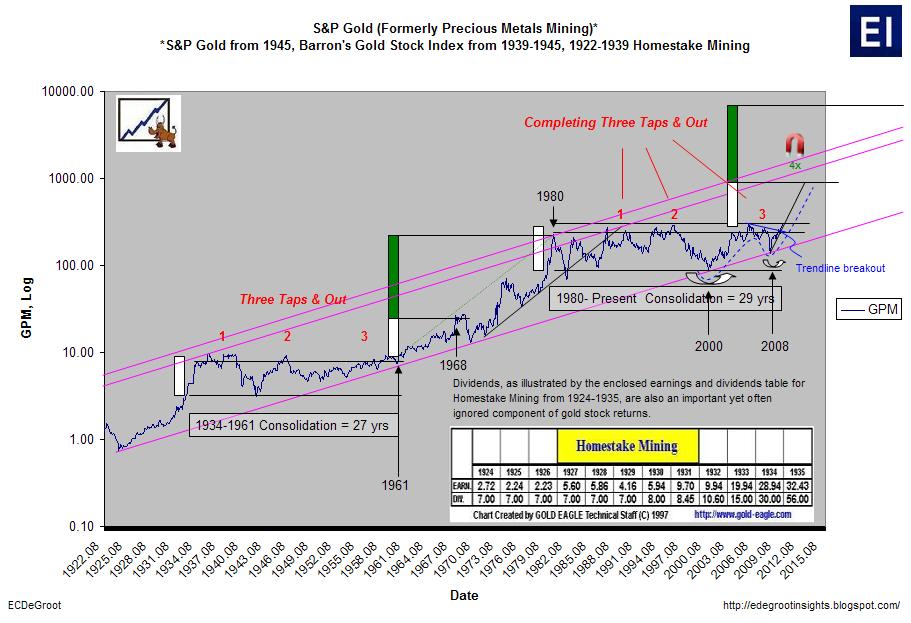
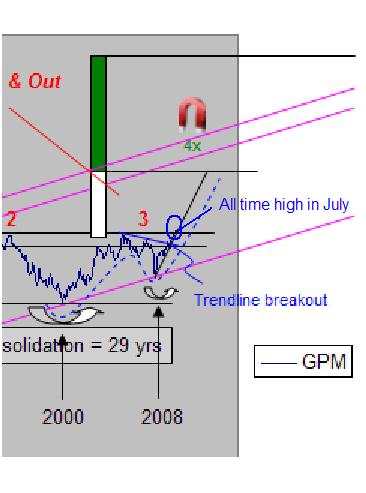
The S&P Gold Index, following gold’s lead, finally posted an all-time high in July 2010. This ended the largest lag since 1971 and marked a technical breach of the 30-year consolidation pattern.
S&P Gold (Formerly Precious Metals Mining)* Zoom:
The correlation between gold and the gold shares has dipped below 0.20 since 2006. This is a significantly deviation from the historical bull market norm of 0.84-0.95. What can only be called “managed pressure” of the gold stocks relative to gold is quantified in the following table:
Historical Correlation and Gold Stocks and Gold:

The gold shares have been depressed through the use of fear, misunderstanding, and disinformation. Certain interests, let’s call it smart money, is essentially picking the public’s gold pocket by relieving them of fractional ownership of gold (money) in the ground and replacing it with paper claims. The beauty of the operation is that public unwilling sweat the short-term pain despite historical precedence is satisfied with the exchange.
On May 19th I implored investors to stand your ground or face the big boot upon resolution of this breakout. There is no stopping it.
Big Boot:

Source: theglobeandmail.com


