Gold Setting Up to Surge After Summer
Gold and gold stocks have been a disappointment over the last two years as they failed to perform amid rising inflation.
With the Fed hiking rates, real yields rising, and the economy likely entering a recession, sentiment is the polar opposite of two years ago. Some are ready to throw in the towel.
However, that would be a massive mistake.
Gold soon will be in a position to again attempt and, next time, make that major breakout through $2100.
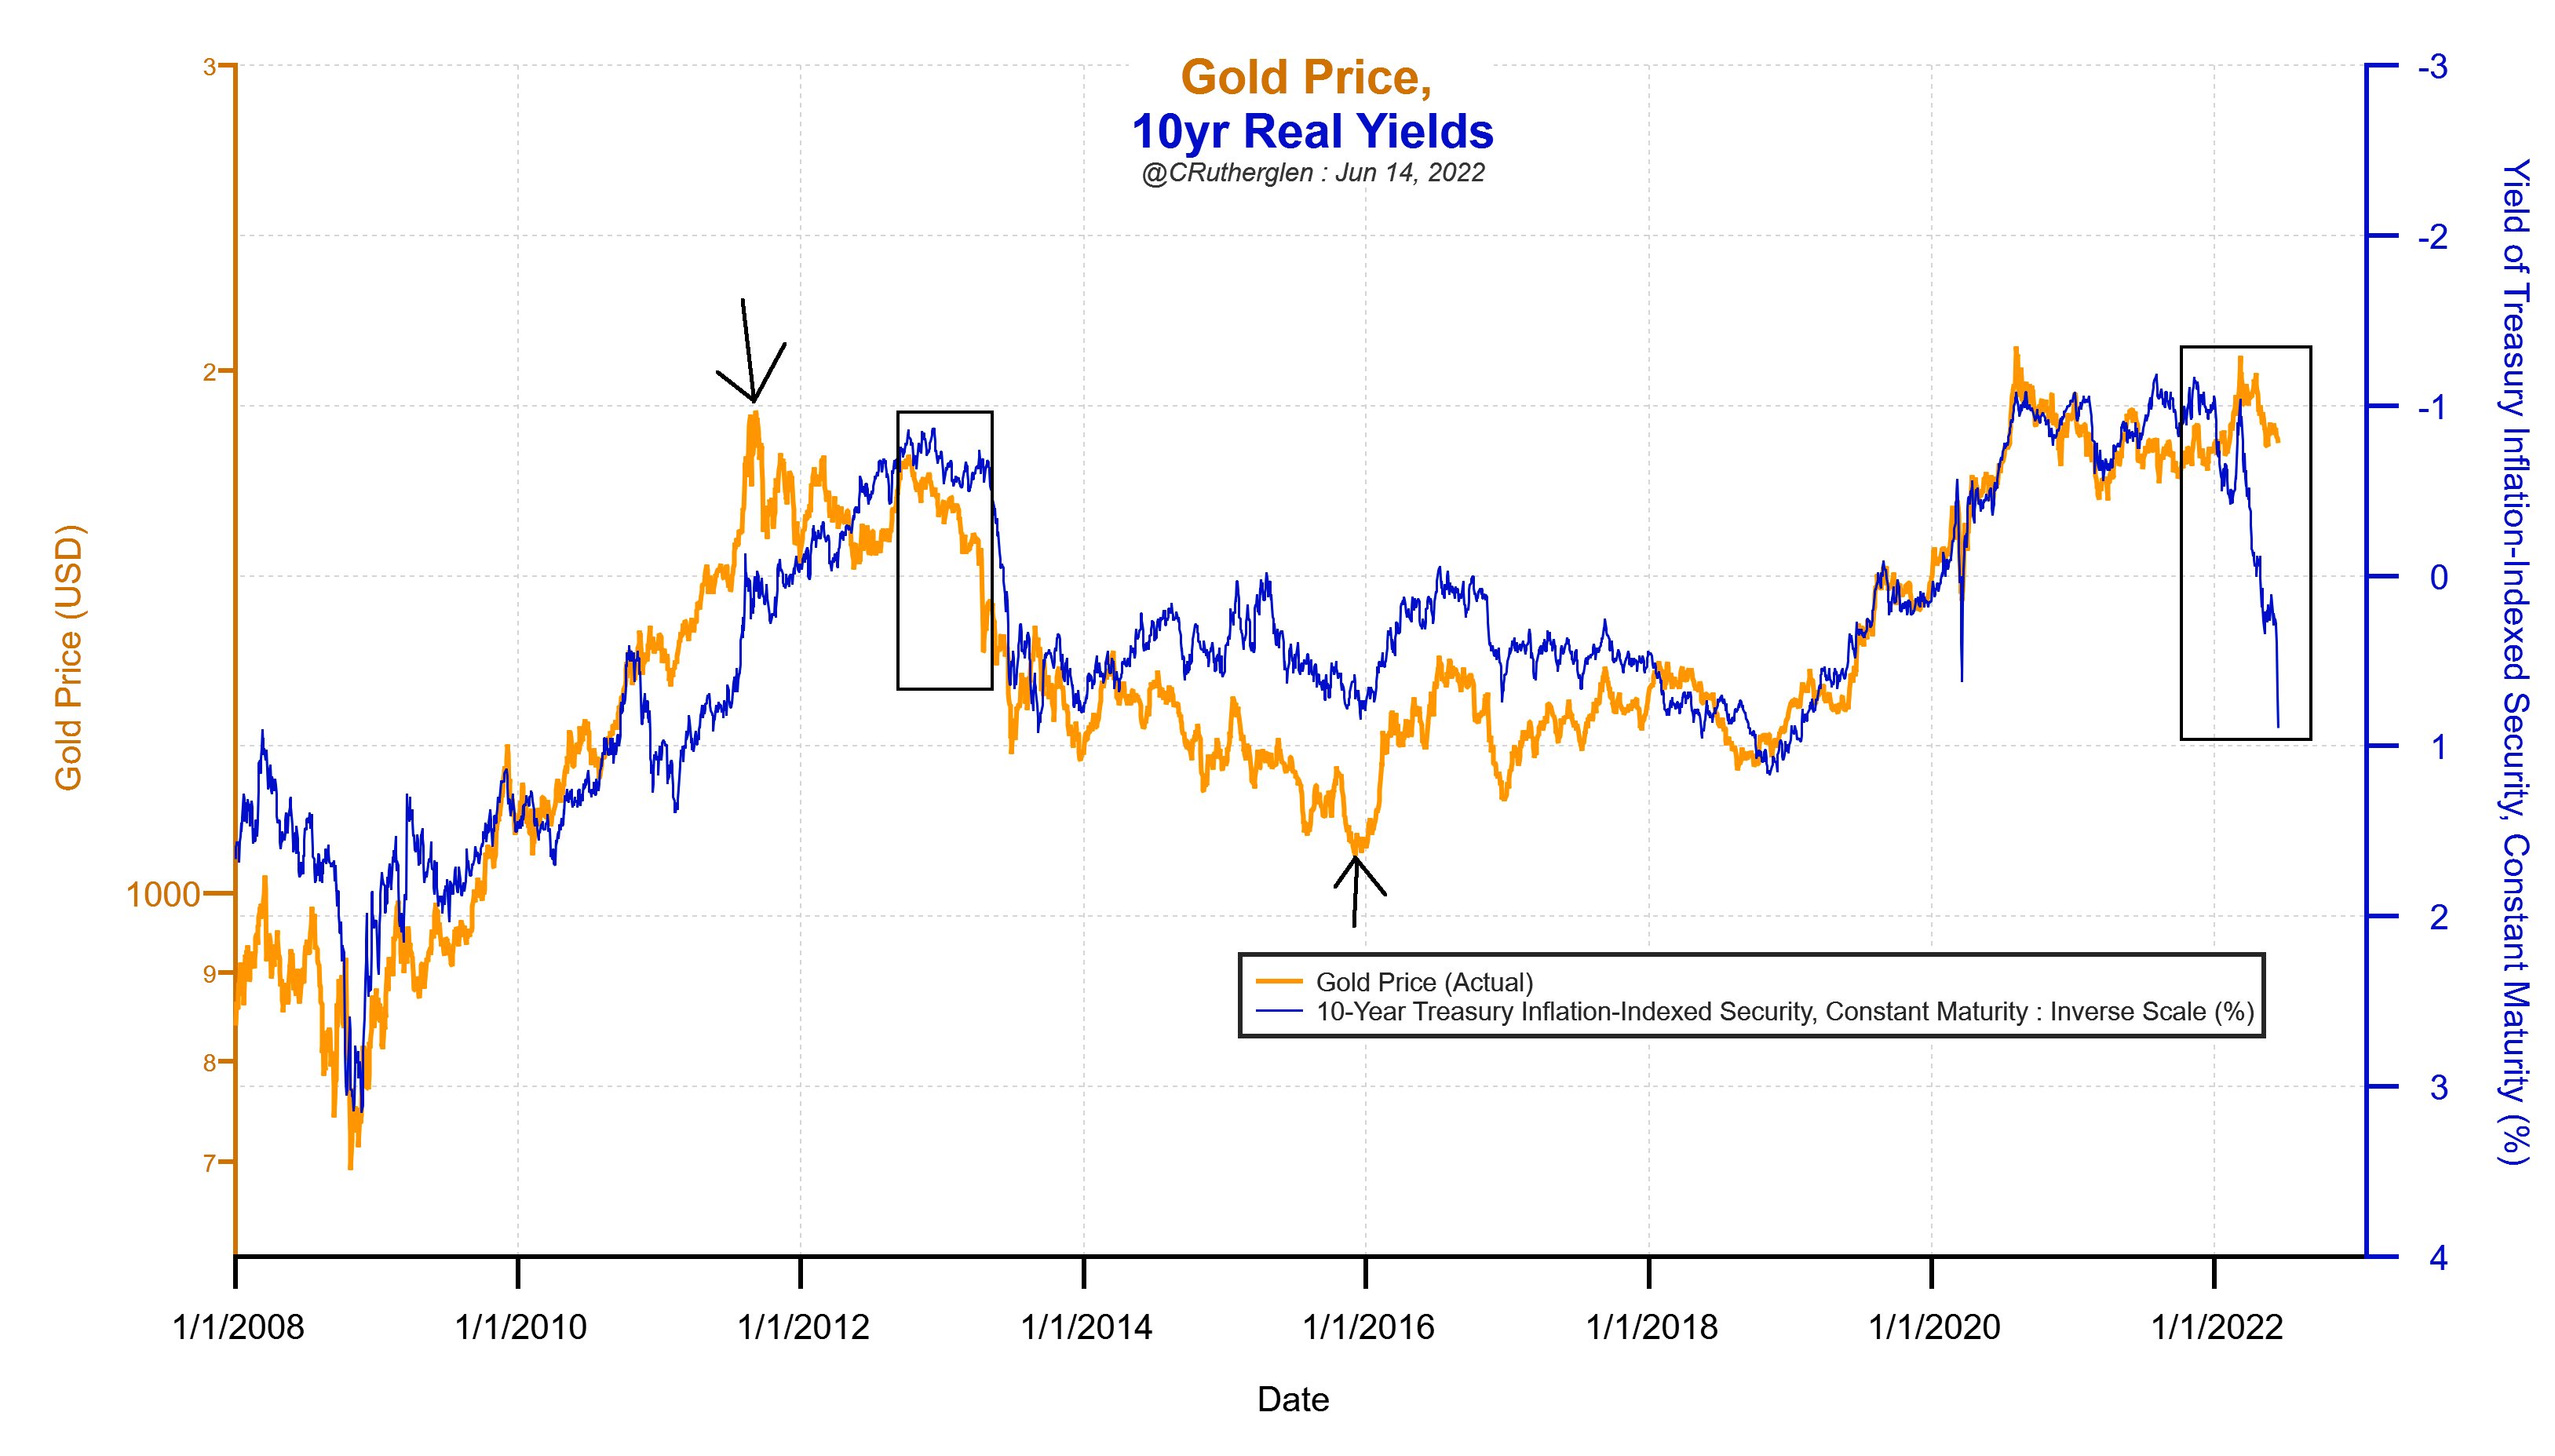
Below is an excellent chart from Chris Rutherglen, which plots Gold along with the (inverse of) real 10-year yield, which many on Wall Street have said has the strongest relationship with Gold.
Looking closely, you can see how Gold leads real yields at key turning points.
Gold peaked in 2011 before real yields (2012) and bottomed at the end of 2015 before real yields (2018). Note how Gold plunged and broke down in 2013 before real yields.
Real yields have exploded higher since November, and Gold is only down marginally. This is a very good sign for Gold.
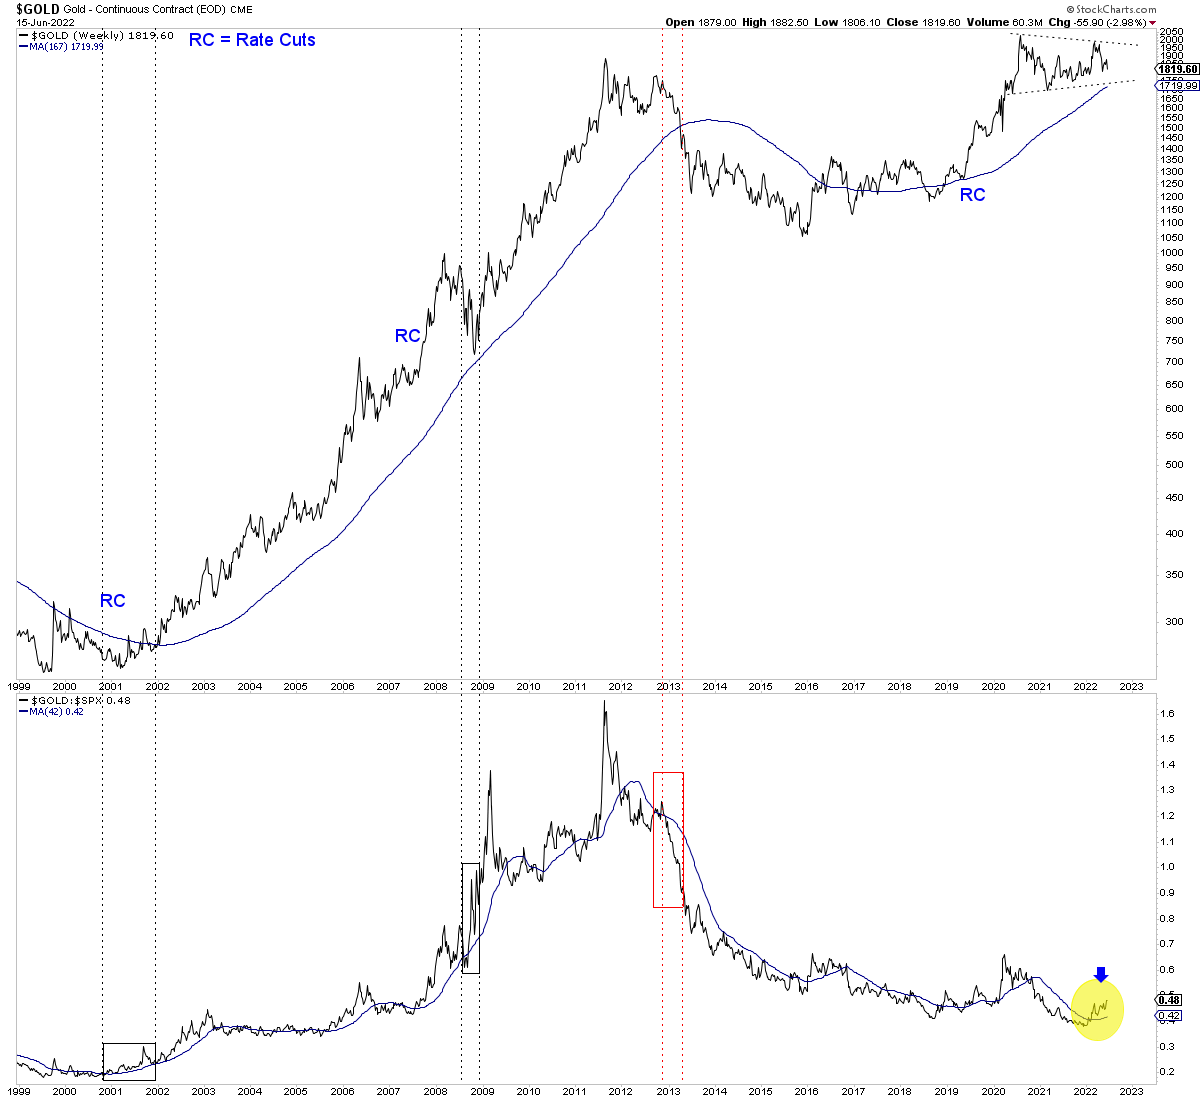
Gold’s outperformance of the stock market is another positive signal for the market.
The Gold to S&P 500 ratio strengthened and made higher highs before Gold did in 2001 and 2008. It also broke down in 2013 before Gold did.
It isn’t easy to see on the chart, but the ratio is a hair from making a 16-month high, and it’s trading above an upward-sloping 200-day moving average.
I have written about how the likely trigger for Gold to rebound and break $2100 is the Federal Reserve ending its rate hikes and then cutting rates.
One might assume that because of the inflation rate, the Fed will continue hiking for a while. That is the market’s current expectation.
However, it’s important to note the history of Fed policy and especially during the inflationary 1960s, 1970s, and 1980s.
In 6 of the last 13 rate hike cycles, the Fed cut rates only one or two months after its final rate hike. The Fed also began rate cut cycles in 1970 with inflation at 6%, in 1974 with inflation at 12%, and in 1980 with inflation at nearly 15%.
The financial and economic system cannot currently handle rates above 3-4%, yield curves are inverting again, and the concern will shift from inflation to recession by the fall. When the recession becomes obvious to everyone, inflation will trend lower.
History argues that if July is the last rate hike, they could cut in September, and if September is the last rate hike, they could cut in November. If the final rate hike is in September or sooner, look for Gold to retest its all-time high by the end of the year.
I continue to focus on finding high-quality juniors with at least 5 to 7 bagger potential over the next few years.
Periodically I will publish and update a list for subscribers of my favorite stocks with at least 10-bagger potential. To learn the stocks we own and intend to buy, with at least 5x upside potential after this correction, consider learning more about our premium service.