“Gold & Silver Mkts: Price & Volume Update” – Morris Hubbartt
UUP (US Dollar Proxy) Chart

- The US government has been running some of the largest deficits in history. You have seen price decline to 76 on the DXY, a 52 week low. The dollar is headed much lower. The dollar is going have a serious sell off and my charts suggest it will occur this year. If the Fed engaged in massive selling of dollars, there could be a total collapse of the currency. It is unknown how many dollars can be printed before the whole system implodes.
- The great danger for US citizens is the rapidly declining purchasing power of the dollar. I don’t think the average citizen has any clue what this means in the years ahead. Sadly, that is exactly the situation that a weak currency creates. Imagine food and gas at triple the current prices.
Gold and Precious Metals
SGOL (Bullion Proxy) 6 Month Chart
SGOL 6 Month Chart Analysis

- America’s government is broken. That fact makes gold and silver your premiere investment, for a long, long time. If a company is broke, its stock declines. If a government is broke, what declines? The currency.
- Gold has been consolidating sideways for six months. In this mother of all gold bull markets, that is classic base building. This consolidation is strengthening the durability of the next phase higher.
- My gold holdings are now larger than at last summer’s bottom. We’re not only going higher, but staying higher. My long term target for gold is $4000, but right now, major league volatility coming to town. If you know how to handle it, you can make a lot of money. First and foremost on your tactics list, is the establishment and maintenance of a large core position. My recommendation is that 65% gold investments must be core position.
- During periods of high volatility, you can make more profits, with less capital at risk! 35% allocated to trading is more than enough action. Gold stocks will enter a new era of price volatility. My trading service already produces more buys and sell signals for gold stocks than all other sectors I trade. To manage the volatility, it’s very important to familiarize yourself with 60 minute charts.
Gold Juniors GDXJ Chart
GDXJ Chart Analysis:
- I just issued a profit taking alert on GDXJ via my 60 minute charts. This quickly reverses the buy from just a week ago. The GDXJ moved 16.8% in just six trading days! Use 60 minute chart buy signals not just to trade GDXJ, but to build core positions in your favorite individual juniors!
- Everything in the economy and financial markets that has propelled gold juniors prices higher is still at work. The government and bank policies that helped to elevate gold and silver are more supportive today than ever before.
- As I issued a powerful buy signal for GDXJ ten days ago at $34.20 of price had entered what I identified as not just support, but critical volume-based support (VBS). VBS is vitally important, because it determines not just whether price will bounced, but whether the low point it bounced from is likely to hold. GDXJ powered out of the $34.20 VBS, and that is a very positive sign.
- Long Term: My SFS Gold Stock Ratio indicates a $75 one year price target for GDXJ is realistic. Beyond that, I’m projected a parabolic rise, to $200 per GDXJ share.
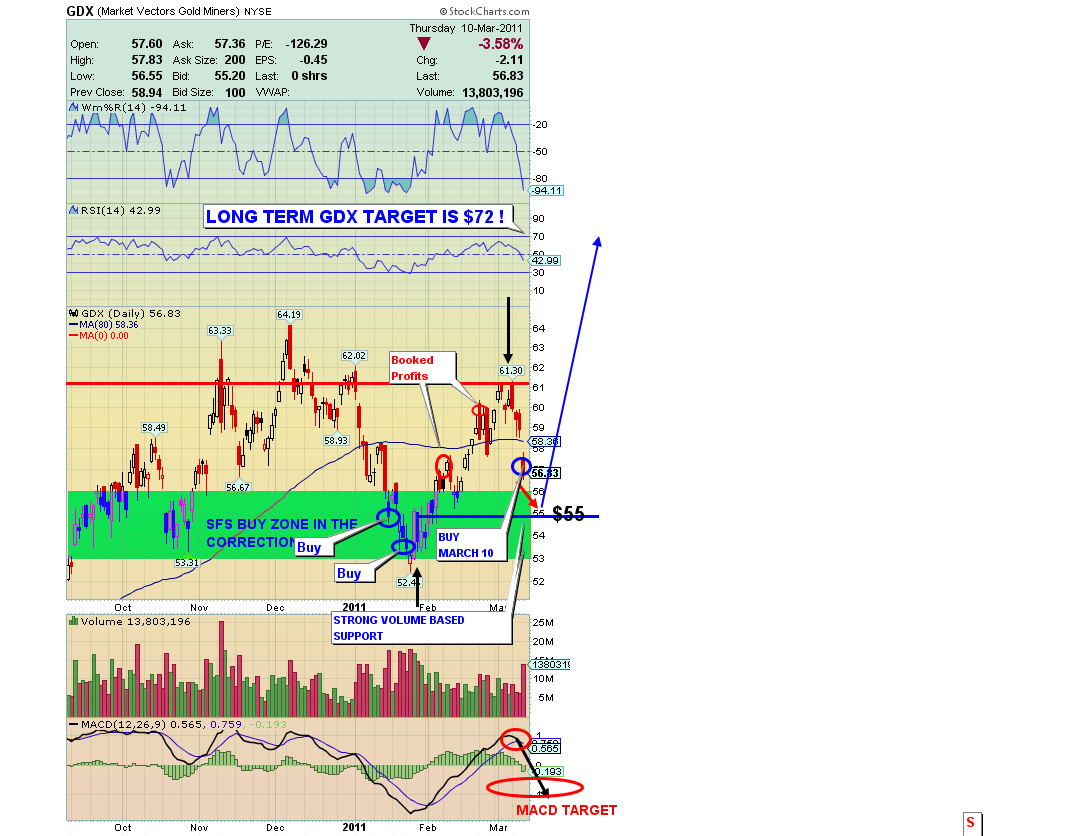
GDX Chart Analysis
- GDX soared 9.58% in six trading days from my last buy signal, and my indicators went to sell on Wednesday and Thursday. The volatility theme is growing for GDX as it is for bullion and the juniors. The sell-off of the last few weeks in the broad stock market initially hurt gold stocks, but the stage is set for much higher highs.
- A look back at a year ago shows gold stocks have slightly outperformed the metal, and I expect that outperformance to grow. I think you will see a sling shot move higher in these stocks before the end of the calendar year. The action you saw Wednesday and Thursday this week will likely be the norm for a day’s trading action by year-end!
- The VBS (volume-based support) for GDX occurs in the same timeframe as it does for GDXJ. Price touched $55.01 for the move down into March 15th. I understand that many investors in the gold community have a tendency to panic with gold stocks, but I would urge you to understand that there is great volume-based support in the $55 area. It is not that easy for price to fall below there.
- Long Term: My SFS Gold Stock Ratio projects a $72 one year price target for GDX.
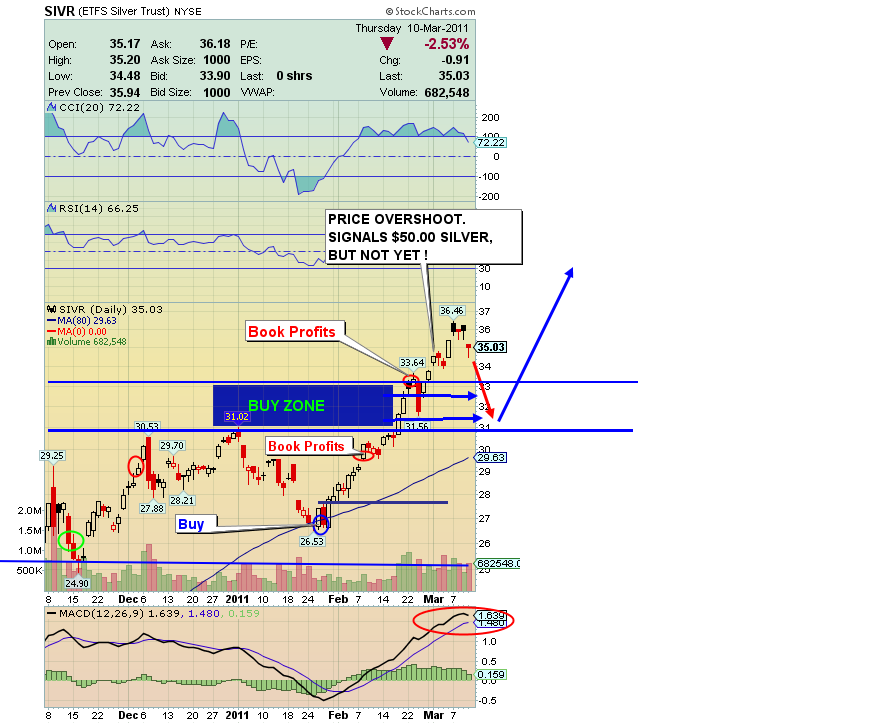
SIVR (Silver Proxy) 6 Mth Chart
SIVR Chart Analysis
- Owning the physical product is an absolute necessity. As I get fresh buy signals in silver, I put more money in physical silver. My latest buys were at $28. Use my buy signals to buy SIVR, and to add to your physical silver inventory
- I issued a profit taking alert for SIVR at $33.26. Silver remains in backwardation even though silver is at multi-decade highs! This demonstrates that the demand for physical silver is not diminishing even with price continuing march higher in price.
- Silver is far more volatile than gold. If general market volatility is going to increase dramatically, then familiarizing yourself with 60 minute silver charts could open the door to enormous trading profits. Don’t use any leverage when trading silver and remember to keep a full 65% of your silver market allocation in physical silver!
Unique Introduction For Web Readers: Send me an email to alerts@superforcesignals.com and I’ll send you 3 of my next Super Force Surge Signals, as I send them to paid subscribers, to you for free! I’ll do that for both my daily and 60 minute chart trading services! Thank-you!
The SuperForce Proprietary SURGE index SIGNALS:
25 SuperForce Buy or 25 SuperForce Sell: Solid Power.
50 SuperForce Buy or 50 SuperForce Sell: Stronger Power.
75 SuperForce Buy or 75 SuperForce Sell: Maximum Power.
100 SuperForce Buy or 100 SuperForce Sell: “Over The Top” Power.
Stay alert for our Super Force Signals, sent by email to subscribers, for both the daily charts on Super Force Signals at www.superforcesignals.com and for the 60 minute charts at www.superforce60.com
About Super Force Signals:
Our SuperForce Signals are created thru our proprietary blend of the highest quality technical analysis and many years of successful business building. We are two business owners with excellent synergy. We understand risk and reward. Our subscribers are generally successful business owners, people like yourself with speculative funds, looking for serious management of your risk and reward in the market.
Frank Johnson: Executive Editor, Macro Risk Manager.
Morris Hubbartt: Chief Market Analyst, Trading Risk Specialist.
Email:
trading@superforcesignals.com
trading@superforce60.com
Super Force Signals
422 Richards Street
Vancouver, BC V6B 2Z4
Canada


