Gold Stocks Continue Bottoming Pattern
A month ago we noted that the gold stocks were headed lower and to a potential double bottom that would create another great buying opportunity. After seven straight weeks of price declines, the gold stocks rebounded last week and are off to a good start this week. We can’t be sure if a double bottom or some complex head and shoulders pattern is developing. Regardless of the specific pattern, a bottom seems to be developing and another great buying opportunity could be at hand.
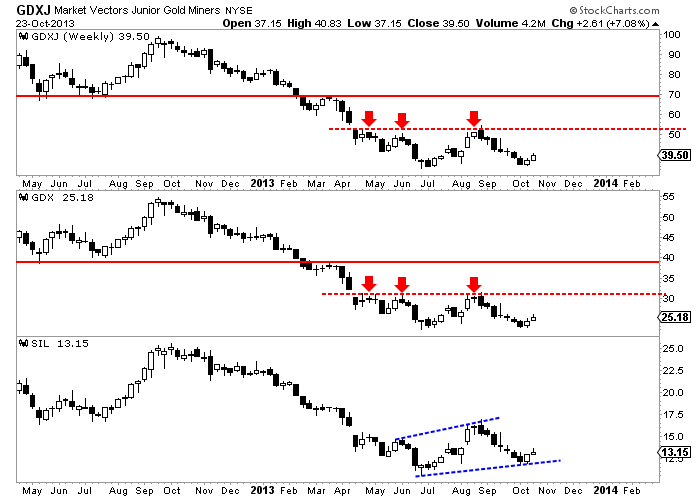
The weekly chart below shows GDX, GDXJ and SIL. We’ve already noted the clear resistance at GDXJ $51 and GDX $31. It appears these markets have at least a few more months of bottoming activity ahead before they can push through that resistance. However, there is near-term upside to be had if the market can rally to that resistance. Meanwhile, the silver stocks as represented by SIL continue to look the strongest. It had the strongest summer rally and it has made a true higher low already.
If we zoom in on GDX we see a few additional positives that bode well for the sector. The three indicators at the bottom are breadth indicators. Breadth can lead price at key turning points. The bullish percent index, smoothed advance decline line and new highs minus new lows indicators are all in a much stronger position compared to the summer bottom. This suggests internal strength is building.

Furthermore, our favorite chart (of course) by itself makes a very strong case. The worst bear markets in gold stocks are 66%-68%. Only one (1980-1982) exceeded that. At the summer low, the gold stocks were down 67%. Furthermore, the three bears that lasted longer (2,3,4) were, at this point in the bear market less oversold than the current bear.

Getting back to the title question, I’m not sure if the gold shares are developing a double bottom or a complex inverse head and shoulders bottom. Double bottoms typically explode off the second bottom and we haven’t really seen that yet. However, that doesn’t invalidate that the market is tracing out some type of major bottom. The shares are six months into this bottoming pattern. If GDX and GDXJ reach resistance in December and breakout in January that amounts to nine months of bottoming. The longer the base is, the greater the eventual breakout. For example, GDXJ upon breaking past $51 would have a measured breakout target of ~$70. That is 77% upside from here.
As we’ve noted in the past, cyclical advances in a bull market average roughly 50% in the first four months and roughly 70% in the first seven months. I also looked at the rebounds from the 2000, 2005 and 2008 bottoms in the Tocqueville Gold Fund, one of the best gold stock funds in my opinion. Over those three periods it averaged a 158% rebound in the first 13 months. Past performance in any market is certainly no indication of future performance but it provides a guide to frame our expectations around. It also implies that patience will be rewarded. As this bottoming process in precious metals moves to its final stages, readers are advised to identify the companies with the best fundamentals and growth potential that are showing relative strength. Focus on the leaders and avoid the laggards. If you’d be interested in our analysis on the companies poised to lead this new bull market, we invite you to learn more about our service.
Good Luck!
Jordan Roy-Byrne, CMT