Here’s Exactly When Gold Bottoms
It’s not advisable to be presumptuous or make absolute statements, but the evidence is convincing.
Before I answer the question, let me set the stage.
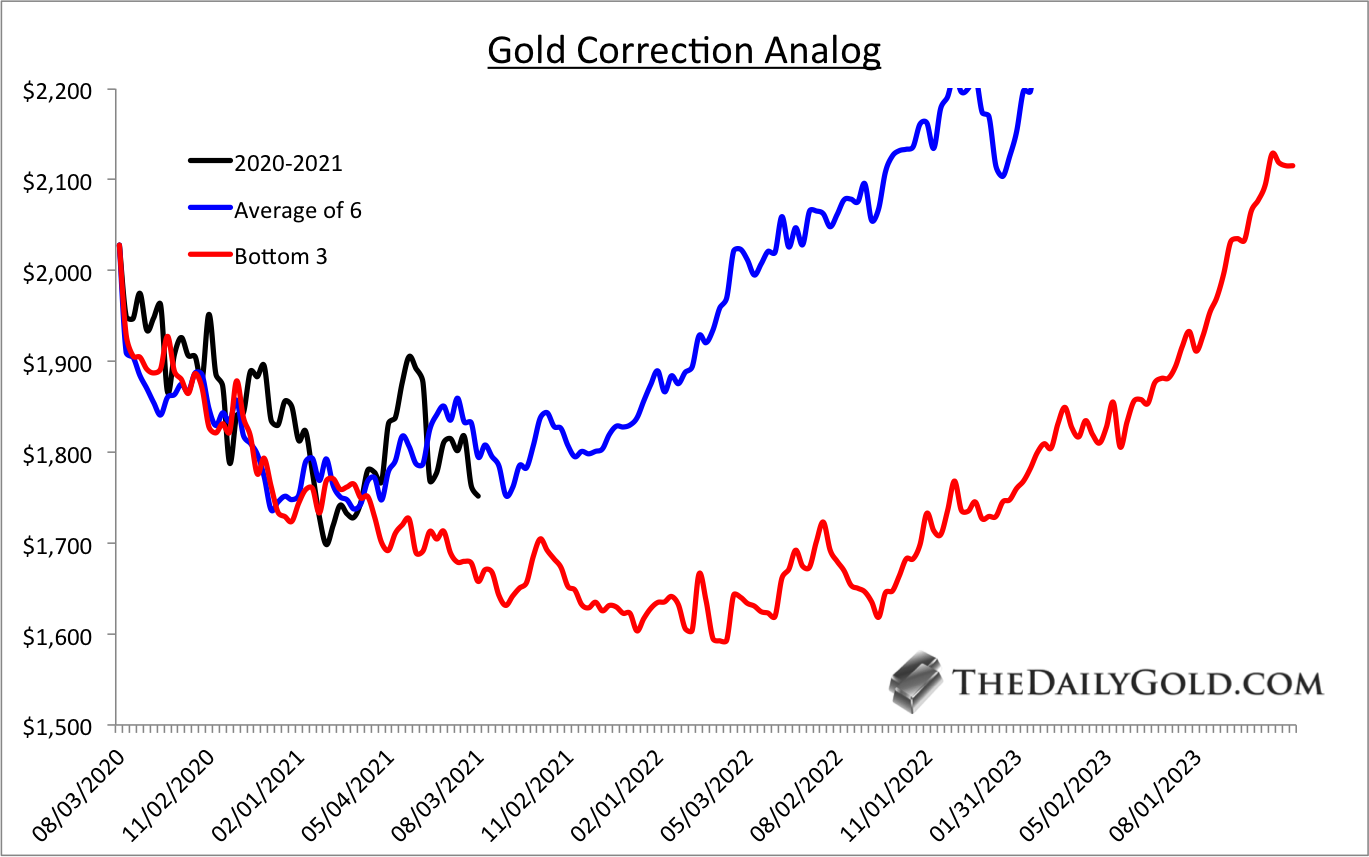
Last week we posted the Gold correction analog chart, which, if we take the average of the three worst bear market corrections, argues for a $1590 bottom in the spring of 2022.
Gold has recovered since the Sunday night flash crash, but the trend is down, and if Gold closes below $1700 in the next few months, it will be hugging the red line below.
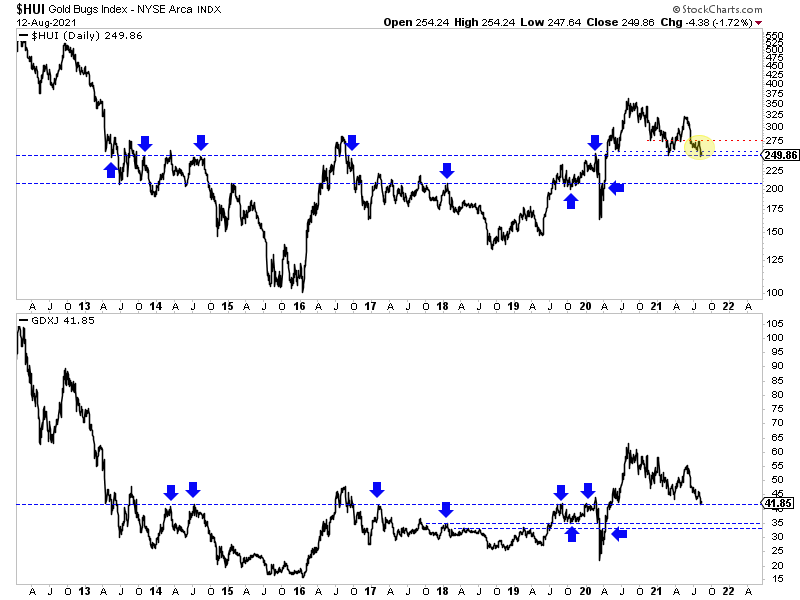
Through Thursday, Gold is down only $11, but HUI (gold producers) and GDXJ (larger juniors) are down 4% on the week.
The gold miners and juniors have led this move lower, and they currently sit in a precarious position.
If the HUI and GDXJ, shown below, lose current lines of support, then they would be likely to drop another 15%-20%. That break aligns with Gold losing $1675 support.
The potential downside is conjuring up fears of 2013 again.
The market is discounting a lower rate of inflation in 2022 and the likelihood of higher nominal yields. Real rates, which drive Gold, blew out on the downside and will increase into 2022. These are similarities to 2013.
However, the larger macro-market picture is completely different.
The chart below plots the gold stocks against the stock market and the CAPE ratio (10-year price to earnings ratio).
As you can see, the gold stocks against the stock market ratio trends inversely to the CAPE valuation. Significant peaks in the CAPE ratio usually mark the start of a secular bull market in precious metals.
The CAPE ratio is 200% higher than in 2009 and 100% higher than in 2011.
Also, note that in 2011, the stock market and economy emerged from the worst recession in decades, and Gold and gold stocks had dramatically outperformed stocks over the previous decade.
Today, valuations for the stock market are in the historical stratosphere while the economy endured a temporary panic after an already record-long expansion. The probabilities argue this economic cycle will be short.

The previous chart reflects that the real bull market in precious metals hasn’t even started yet. Just wait until stagflation hits or the economy needs another infusion of fiscal support.
Turning to the present and issue at hand, the turning point for Gold will be the next Fed rate hike.
In the chart below, we plot the Fed Funds rate and Gold.
There have been eight rate hike cycles in the last 50 years. Two of them were in the early 1980s, and Gold was trending higher into those hikes. That does not apply to today.
The other rate hike cycles began in early 1972, late 1976, 1993, 1999, 2004, and at the end of 2015. Huge bull markets followed three of these, while Gold averaged a rebound of 30% during the other three (1993, 1999, 2016).
We should also note the two most significant lows in the past 40 years (1999 and 2016) coincided with fresh rate hikes.

When the market begins to discount tighter policy from the Fed, it usually hurts Gold. However, Gold bottoms when they execute the first rate hike.
At present, this analysis is a double-edged sword for Gold. The sooner the Fed hikes rates; the sooner Gold will bottom. But it’s bearish for Gold until it happens.
Investing in this sector can be excruciating.
To stay in the game, one has to cut losses quickly and trim big winners. Not every stock pick will work, nor will your timing always be precise.
As per my article last week, I’m focused on finding the producers and developers with 7 to 10-bagger potential over the next two to three years. There is less long-term risk as these types of companies can add value irrespective of metals prices.
With respect to explorers, one may be able to find some incredible values (and in high-quality companies) around the time the Fed hikes rates.
In our premium service, we continue to identify and research those companies with considerable upside potential over the next 24 months. To learn the stocks we own and intend to buy, with at least 5x upside potential after this correction, consider learning more about our premium service.