Implications of Reversal in Gold
Amid the de-escalation of US-Iran tension, Gold reversed course sharply. On Tuesday, Gold shot up to $1613/oz before closing down at $1560/oz.
This was not a surprise because the gold stocks peaked days earlier. As Gold surged to start January, first to $1550/oz and then higher, its strength was not confirmed by the gold stocks.
The shares usually lead the metals at turning points. They were outperforming the metals before recent strength, and they were underperforming badly as the calendar turned.
While Gold and Silver will have ugly reversal candles on their charts, the reversal is not worrisome because there is no fundamental shift.
The Fed is not going to hike rates if inflation picks up. They have told us as much. Nor will they forego cutting rates of conditions slow down again.
Gold, Silver, and gold stocks remain well above long-term moving averages, and their uptrends are intact.
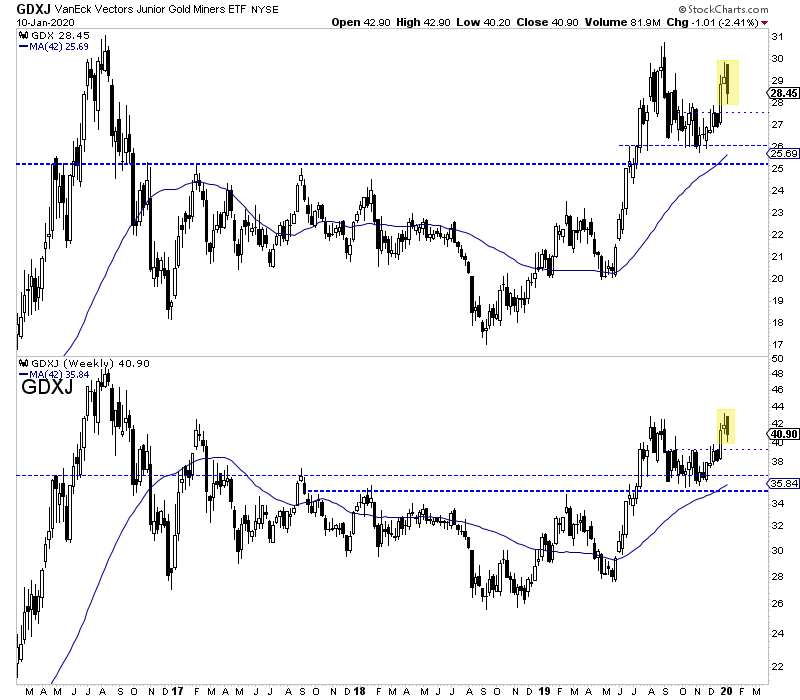
We plot the weekly candle charts of GDX and GDXJ below.
The two most recent candles are bearish and suggest GDX and GDXJ could trade below initial support around $27.50 and $39.50. The rising 42-week moving averages (equivalent to 200-day moving averages) should form a confluence of strong support around GDX $26 and GDXJ $37 in the next month or two.
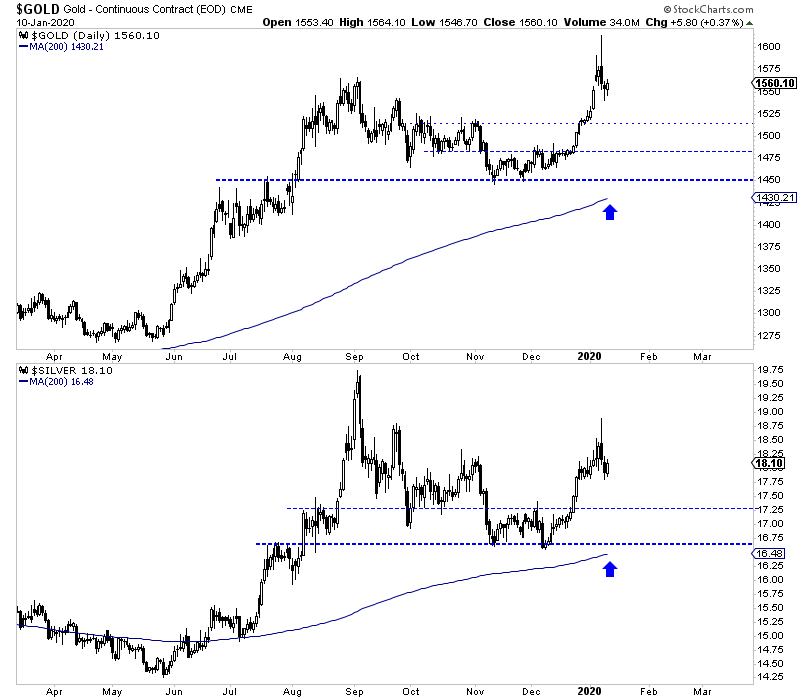
We anticipate something similar in the metals. The daily candle chart below highlights the bearish reversals that occurred on Wednesday.
Gold, which closed at $1560/oz, has support at $1480/oz and reliable support at $1450. By the end of March, Gold’s 200-day moving average could approach $1480/oz.
Silver, which closed at $18.10, has support at $17.25 as well as reliable support at $16.50, which includes the 200-day moving average.
We expect precious metals will continue the correction and consolidation that essentially began at the end of summer. Still, that weakness could be mitigated by a potential correction in the stock market.
The stock market is up 40% over the past 12 and a half months, and a variety of sentiment indicators are screaming caution. For example, the short interest in the S&P 500 ETF is at a 2-year low.
Also, @SentimenTrader notes that: On December 24 of 2018, 54% of their core indicators showed extreme pessimism. On December 27 of 2019, 55% of their core indicators showed extreme optimism. That’s the most in 15 years.
To sum things up, the reversal implies that precious metals will continue to correct within a larger bullish consolidation with the potential of testing 200-day moving averages before spring.
If GDX and GDXJ are going to make that huge breakout this year, as we expect, then the weeks ahead would be one of your last best chances to get positioned.
We continue to focus on identifying and accumulating the juniors with significant upside potential in 2020.