New Gold & Silver Bull Analogs
Back during the bear market years (it’s nice to be able to write that now), I regularly would compare the declines in Gold, Silver and gold stocks to their past history. It gave us a visual representation of just how bad the forever bear market was and helped us decipher when it might end.
Thankfully that is all behind us.
Now it’s time to compare recent bullish moves to past iterations.
First is Silver.
The recent low in Silver has several good comparisons, which include the lows in 1986, 1993 and 2003. We also included the 2008 low.
If Silver’s rebound were simply an average of the four rebounds shown then it would reach nearly $24 by the end of March 2020.

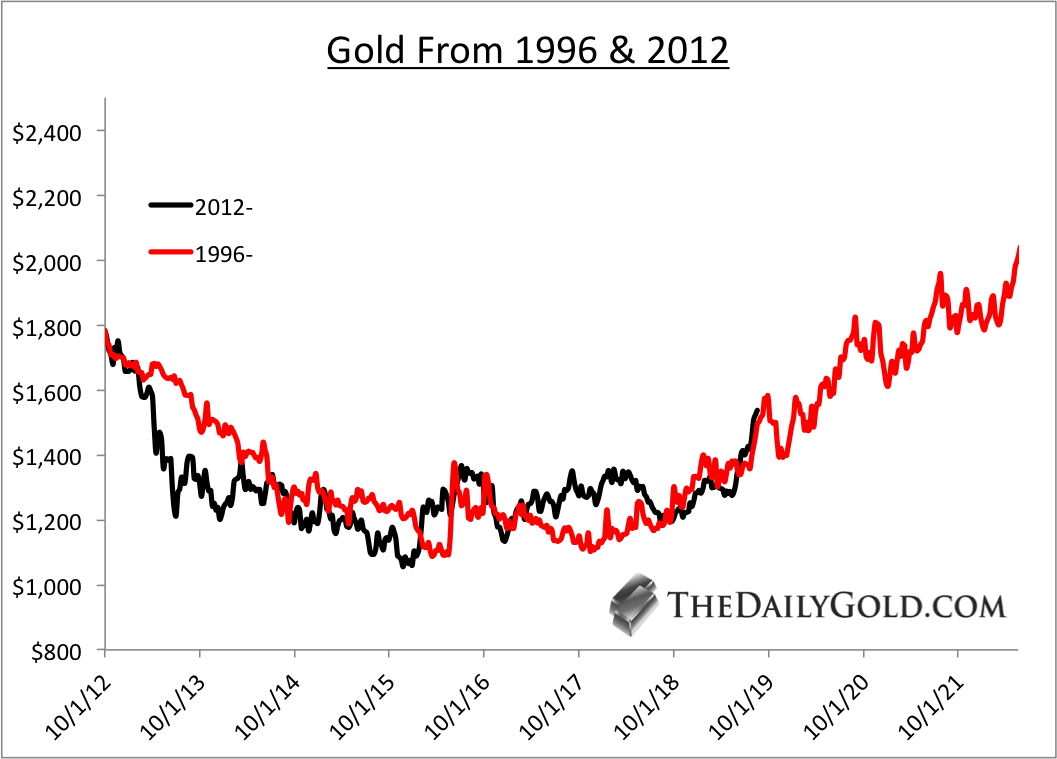
Gold is tricky because there is not an obvious bull comparison. Its major lows were essentially in 1970, 1985 and 1999 to 2001.
However, when we consider the preceding bear market, the best comparison to the recent bear and current bull is the late 1990s and early 2000s.
Mind you, we aren’t forecasting or predicting that 2003 to 2006 will be duplicated over the next three years. It’s possible, but we are simply arguing that the 2012 to 2019 period most resembles 1996 to 2003.
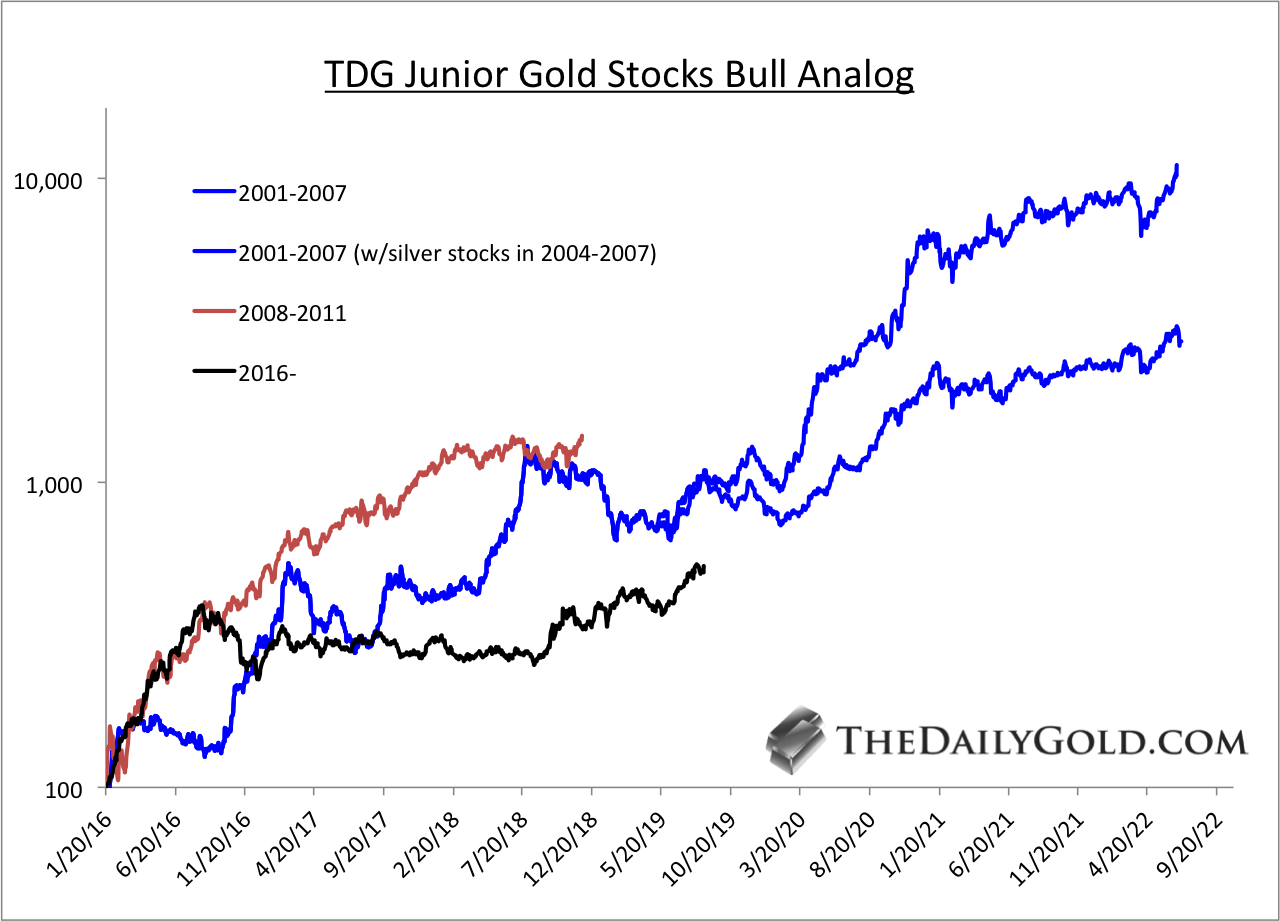
Turning to the gold stocks and specifically the junior gold stocks, here is how the 2016 bottom compares to the bottoms in 2001 and 2008.
Note that the basket of 20 stocks we used is quite strong compared to GDXJ. In other words, we erred on the side of positive performance.
In our new book (available at TheDailyGold.com), we argue that the 2016 low in gold stocks was very similar to the 1957 low.
There are numerous similarities between today and the early to mid 1960s. That includes the gold stocks and their incredible long-term value at the start of a major inflationary cycle.
Below we compare the 1957 and 2016 lows with data from the Barron’s Gold Mining Index, which appreciated over 40-fold from its 1957 low to the peak in 1980.
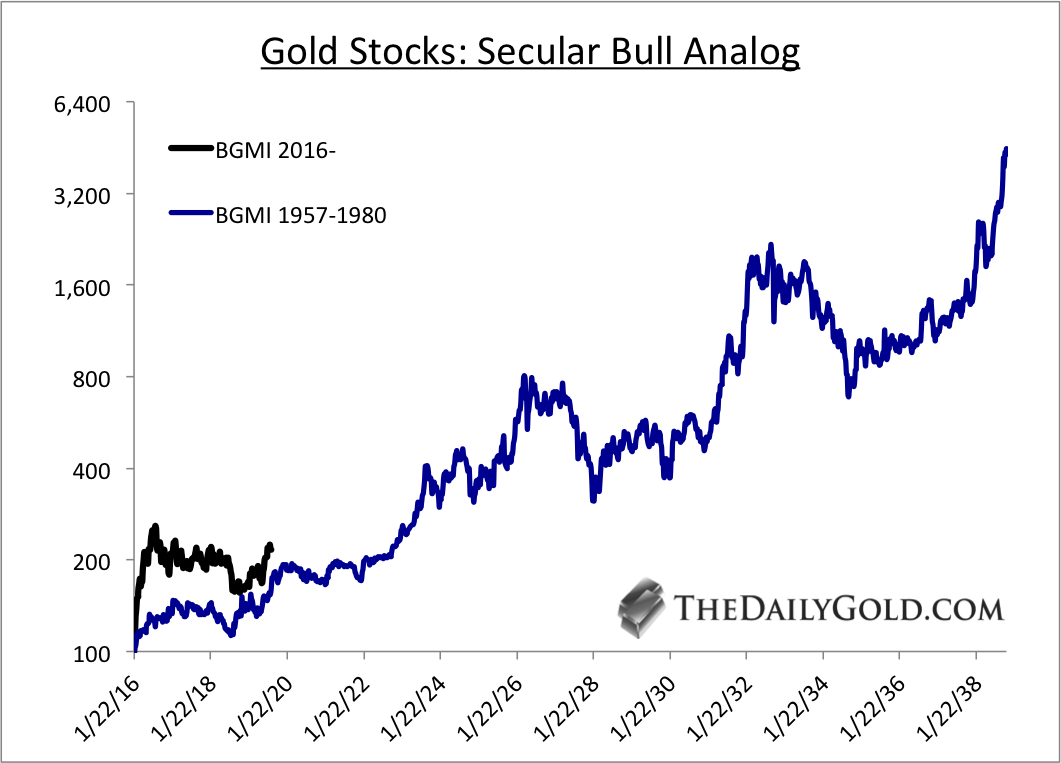
As you can see, if Gold remains in a real bull market then significant upside potential remains in place across the precious metals complex.
Fundamentally, Gold could remain in a bullish trend until the next economic recovery gains traction. That could be anywhere from a few to four years away.
If gold continues to follow the pattern of the early 2000s then it could reach $3000/oz by the start of 2023. To learn the stocks we own and intend to buy that have 3x to 5x potential, consider learning more about our premium service.